The upcoming holidays didn’t appear to distract Northern California home shoppers in November, as the months’ supply of inventory (MSI) declined or held steady from October in almost every one of Pacific Union’s regions. In fact, the MSI reached or tied yearly lows in the East Bay, San Francisco, Silicon Valley, Sonoma County, and Sonoma Valley, as well as in the Tahoe/Truckee region.
Wine Country real estate remained a hot commodity, with the November median sales price climbing to an annual high in Napa County and Sonoma Valley. Single-family home prices in the Tahoe/Truckee region also hit one-year highs, as buyers clamored to purchase a property before the ski season kicks off.
Click on the image accompanying each of our regions below for an expanded look at local real estate activity in November.
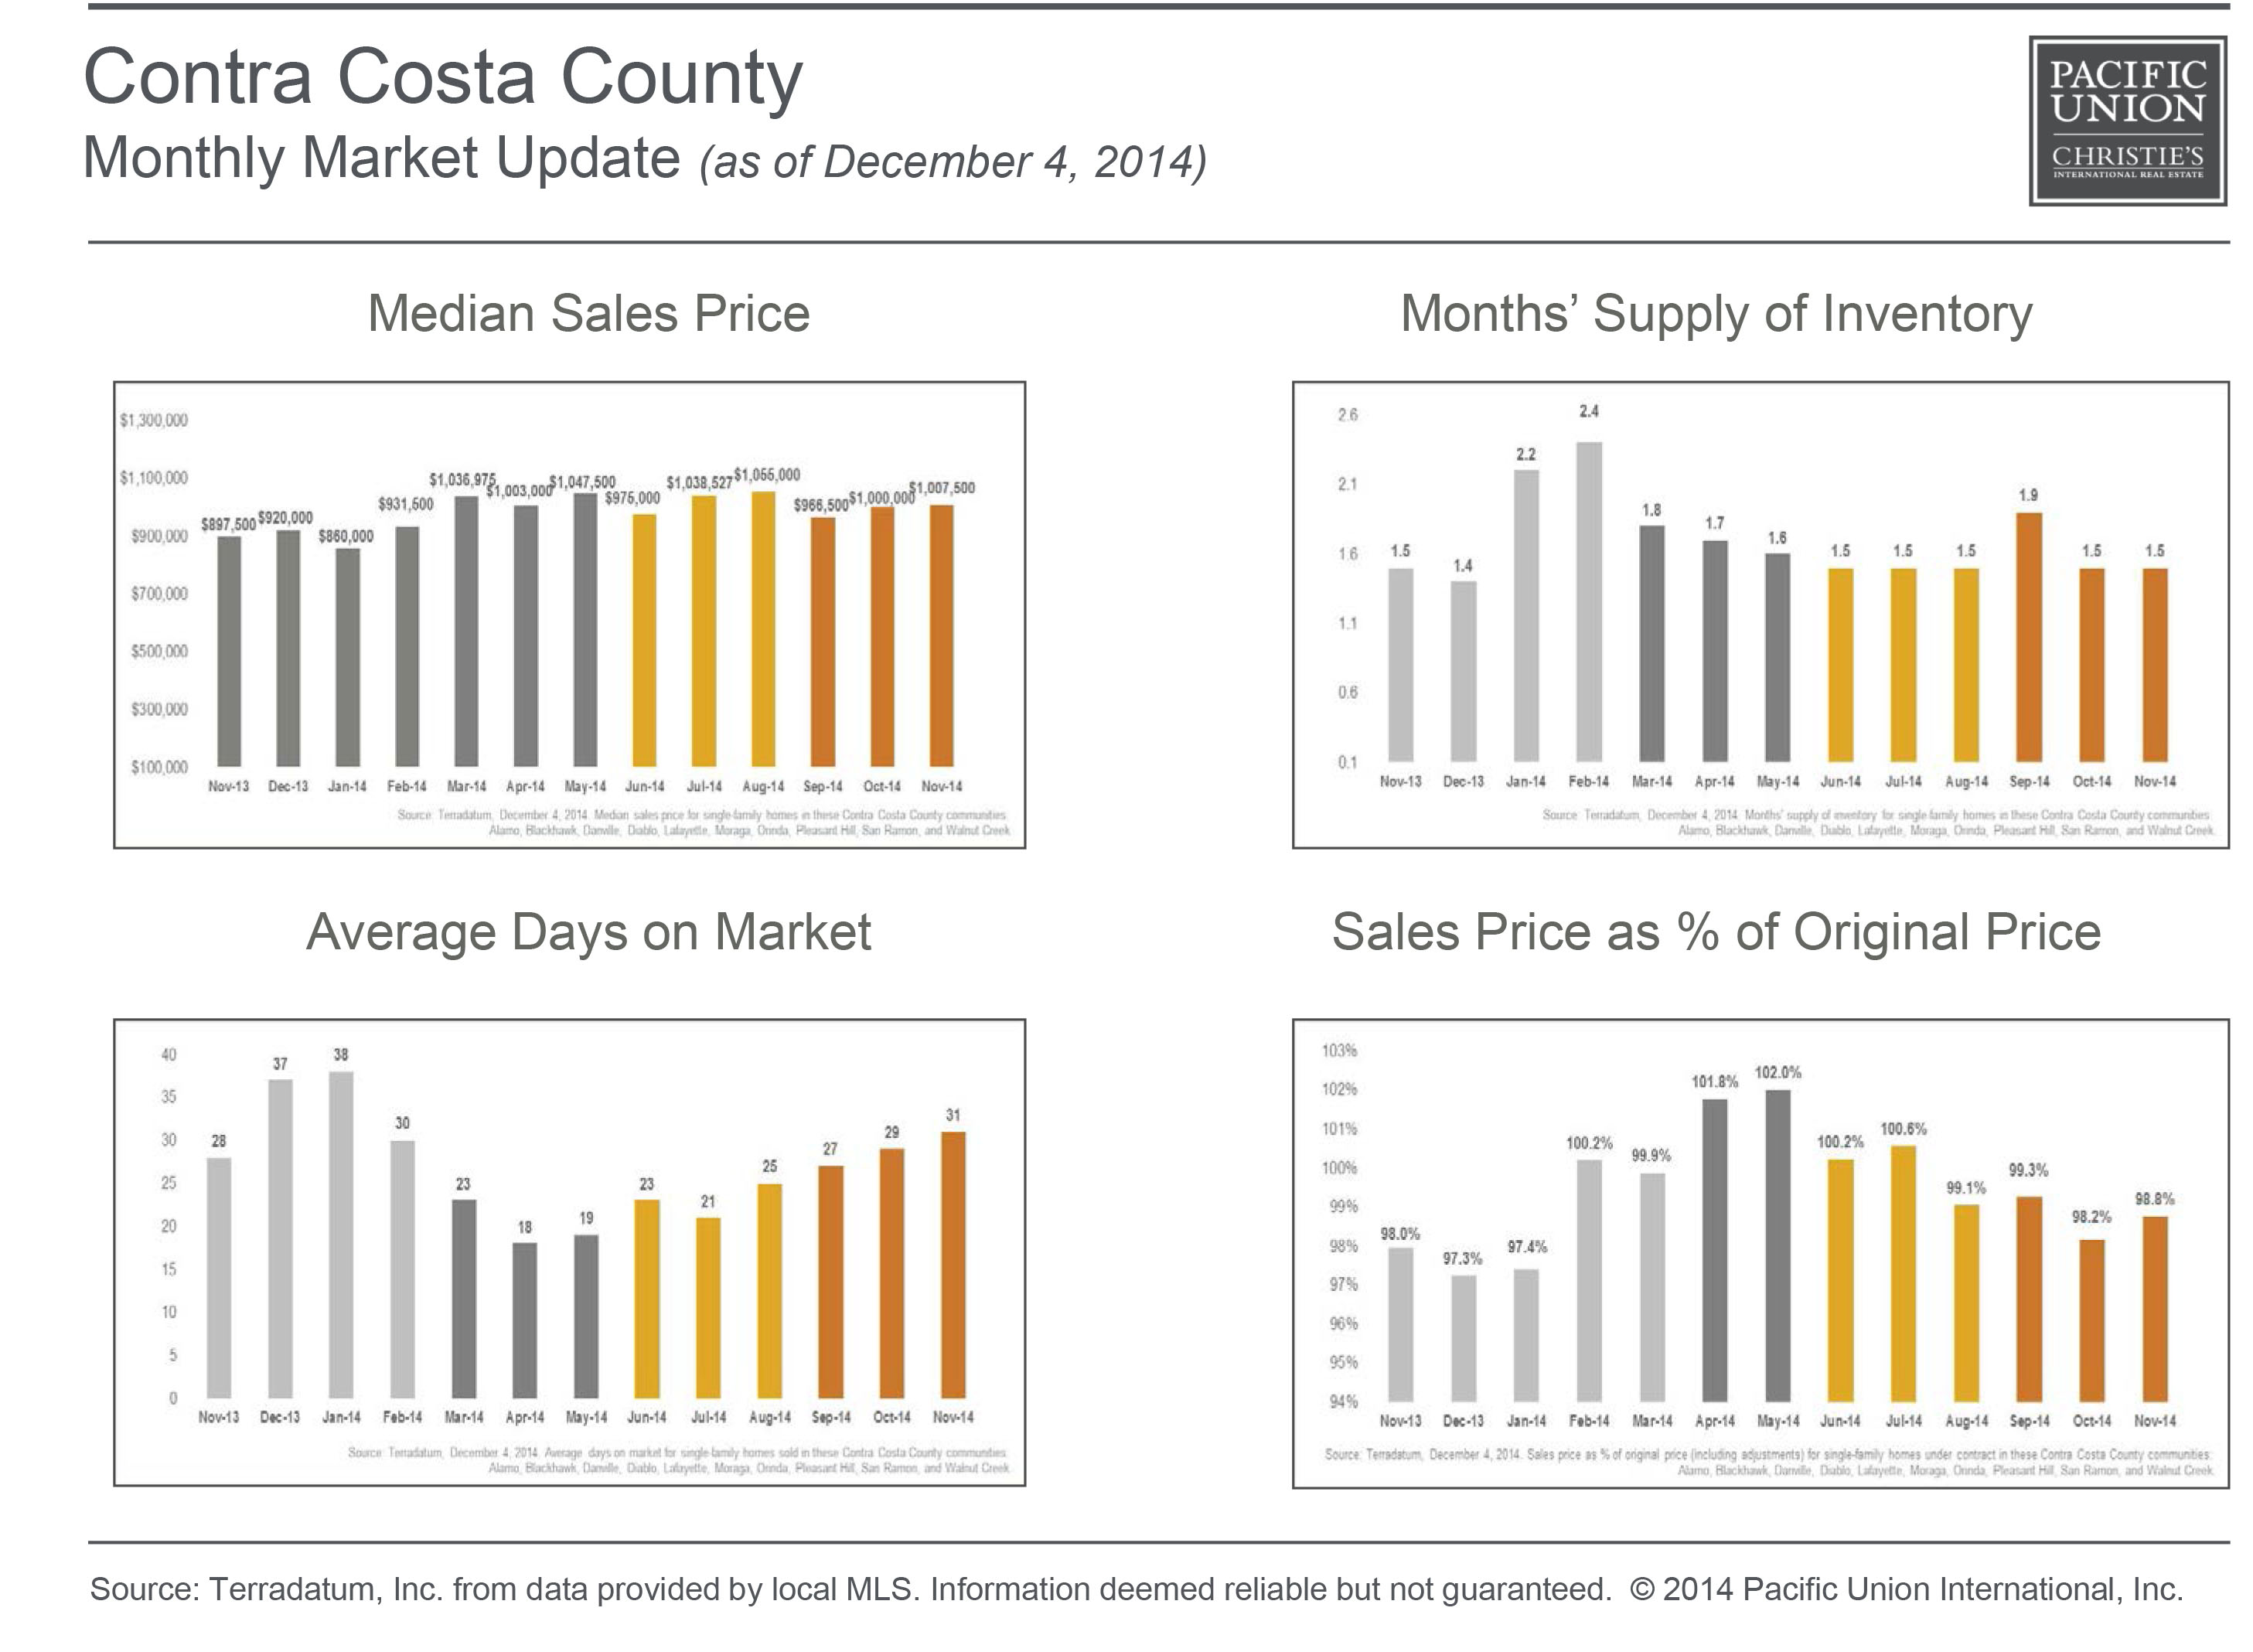
CONTRA COSTA COUNTY
The median sales price for a single-family home in our Contra Costa County region was up slightly from the previous month and closed November at just above $1 million. Buyers paid an average of 99 percent of original prices, also a tiny increase from October.
At 1.5, the MSI was identical to levels observed since the early summer, with the exception of a brief uptick in September. Contra Costa homebuyers took an average of 31 days to purchase a home, the longest amount of time since the beginning of 2014.
Defining Contra Costa County: Our real estate markets in Contra Costa County include the cities of Alamo, Blackhawk, Danville, Diablo, Lafayette, Moraga, Orinda, Pleasant Hill, San Ramon, and Walnut Creek. Sales data in the adjoining chart includes single-family homes in these communities.
EAST BAY
Most individual Bay Area housing markets remain heavily tilted in favor of sellers, but the East Bay is arguably the most skewed. In November, the MSI dipped to 0.7 – a yearly low – and sellers took home an average of 12 percent over asking price, the highest premium in any of Pacific Union’s Northern California regions. 
The median sales did relax a smidgen from the previous month, dipping to $826,000. Buyers took an average of 20 days to close a sale, consistent with general patterns observed since April.
Defining the East Bay: Our real estate markets in the East Bay region include Oakland ZIP codes 94602, 94609, 94610, 94611, 94618, 94619, and 94705; Alameda; Albany; Berkeley; El Cerrito; Kensington; and Piedmont. Sales data in the adjoining chart includes single-family homes in these communities.
MARIN COUNTY
After dipping into the six-figure range in October, the median sales price in Marin County climbed back above $1 million in November. The MSI went in the opposite direction, falling to 1.6, though the month-over-month change was not dramatic.
Homes took an average of 59 days to sell, very close to numbers recorded one year earlier. Sellers received an average of 96 percent of asking price, a bit less than in the preceding few months.
Defining Marin County: Our real estate markets in Marin County include the cities of Belvedere, Corte Madera, Fairfax, Greenbrae, Kentfield, Larkspur, Mill Valley, Novato, Ross, San Anselmo, San Rafael, Sausalito, and Tiburon. Sales data in the adjoining chart includes single-family homes in these communities.
NAPA COUNTY
Home prices in Napa County have risen in odd-numbered months and fallen in even-numbered months all year, and this trend continued in November, with the median sales price increasing to $610,000, a yearly high. At 3.7, the MSI was unchanged from the previous month.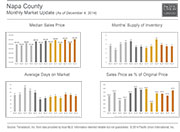
Napa homebuyers took an average of 81 days to finalize a sale – about a week quicker than in October – and paid an average of 95.1 percent of original price, the most since the early summer.
Defining Napa County: Our real estate markets in Napa County include the cities of American Canyon, Angwin, Calistoga, Napa, Oakville, Rutherford, St. Helena, and Yountville. Sales data in the adjoining chart includes all single-family homes in Napa County.
SAN FRANCISCO – SINGLE-FAMILY HOMES
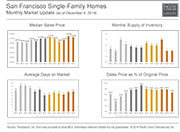
November single-family home sales data in San Francisco was fairly similar to October: the MSI held steady at a low 1.1, and the average home took just about a month to leave the market.
The median sales price in the city was above $1 million for the eighth month this year and closed November at $1.16 million. Continuing a pattern that has persisted throughout 2014, the average successful buyer could expect to pay a premium for a single-family home in San Francisco, this time by about 7 percent.
SAN FRANCISCO – CONDOMINIUMS
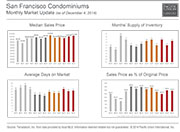
For the third time this year, the median sales price for a San Francisco condominium in November was north of the $1 million mark: $1.03 million to be precise. Condominium shoppers in the city also shelled out 6 percent more than original price, nearly identical to numbers recorded in October.
Unlike in most other part of the Bay Area, San Francisco condominium inventory grew month over month, with the MSI inching up to 1.6. Properties sold in an average of 37 days, almost exactly the same amount of time as in October.
SILICON VALLEY
Pacific Union’s Silicon Valley region remains our region’s most expensive place to purchase a home, with the median sales price at exactly $2.5 million in November. Silicon Valley homebuyers have been paying more than asking price all year, and sellers received average premiums of 3.5 percent last month.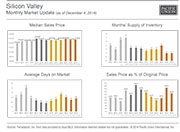
Buyers scooped up properties in an average of 28 days, a few days longer than in October. At 1.1, the MSI was unchanged from the previous month and remains at a one-year low.
Defining Silicon Valley: Our real estate markets in the Silicon Valley region include the cities and towns of Atherton, Los Altos (excluding county area), Los Altos Hills, Menlo Park (excluding east of U.S. 101), Palo Alto, Portola Valley, and Woodside. Sales data in the adjoining chart includes all single-family homes in these communities.
Mid-Peninsula Subregion
At $1.36 million, November’s median sales price in our Mid-Peninsula subregion stayed in the same general range as it has been since the midsummer. The MSI inched up to 1.0 in November but was still very close to its 2014 low.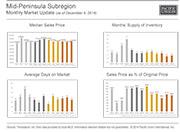
Homes left the market in an average of 25 days, nearly identical to levels recorded one year ago. Buyers paid just about 1 percent more than asking price on average, just as they did in October.
Defining the Mid-Peninsula: Our real estate markets in the Mid-Peninsula subregion include the cities of Burlingame (excluding Ingold Millsdale Industrial Center), Hillsborough, and San Mateo (excluding the North Shoreview/Dore Cavanaugh area). Sales data in the adjoining chart includes all single-family homes in these communities.
SONOMA COUNTY
The median property sales price in Sonoma County has been gradually relaxing for the past couple of months and drifted down to $480,500 in November. Buyers continue to enjoy slight discounts and paid an average of 95.4 percent of original price.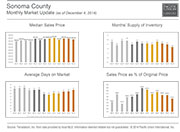
For the first time in more than a year, the MSI in Sonoma County dipped below 2.0, finishing November at 1.8. Properties sold in an average of 73 days, giving buyers a few extra days than they had in September and October.
Defining Sonoma County: Our real estate markets in Sonoma County include the cities of Cotati, Healdsburg, Penngrove, Petaluma, Rohnert Park, Santa Rosa, Sebastopol, and Windsor. Sales data in the adjoining chart includes all single-family homes and farms and ranches in Sonoma County.
SONOMA VALLEY
Pacific Union’s Sonoma Valley region saw the median sales price soar to $750,000 in November, a robust year-over-year increase of 50 percent. The MSI in the region has been declining since August and reached a one-year low of 1.8.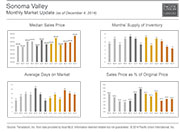
Homebuyers still managed to avoid paying full price, with the average property fetching 93.5 percent of original price. Homes stayed on the market for an average of 77 days, shorter than either of the preceding two months.
Defining Sonoma Valley: Our real estate markets in Sonoma Valley include the cities of Glen Ellen, Kenwood, and Sonoma. Sales data in the adjoining chart refers to all residential properties – including single-family homes, condominiums, and farms and ranches – in these communities.
TAHOE/TRUCKEE – SINGLE-FAMILY HOMES
The median sales price for a single-family home in the Tahoe/Truckee region saw big year-over-year growth in November, rising to $740,000, an annual gain of 32 percent. Inventory the region has been steadily dropping since the summer in anticipation of the ski season, and November’s MSI of 4.5 represents a yearly low.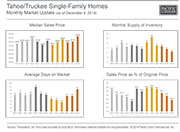
Still, buyers were in no rush to close a purchase, with the average single-family home in the region taking more than four months to sell. On average, buyers paid about 90 percent of original price, less than they have at any point since the spring.
Defining Tahoe/Truckee: Our real estate markets in Tahoe/Truckee include the communities of Alpine Meadows, Donner Lake, Donner Summit, Lahontan, Martis Valley, North Shore Lake Tahoe, Northstar, Squaw Valley, Tahoe City, Tahoe Donner, Truckee, and the West Shore of Lake Tahoe. Sales data in the adjoining chart includes single-family homes in these communities.
TAHOE/TRUCKEE – CONDOMINIUMS
There are still plenty of available condominiums in the Tahoe/Truckee region, with the MSI unchanged from October at 6.1. November’s $385,000 median sales price was down about $30,000 from the previous month.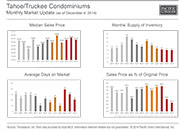
Buyers paid an average of 87 percent of asking prices, the biggest discounts we’ve observed in the past year. Condominiums in the region left the market in 106 days, the quickest pace of sales since the late summer.
Defining Tahoe/Truckee: Our real estate markets in Tahoe/Truckee include the communities of Alpine Meadows, Donner Lake, Donner Summit, Lahontan, Martis Valley, North Shore Lake Tahoe, Northstar, Squaw Valley, Tahoe City, Tahoe Donner, Truckee, and the West Shore of Lake Tahoe. Sales data in the adjoining chart includes condominiums in these communities.