Homebuyers were out in droves as the fourth quarter kicked off, with inventory decreasing from the previous month in all eight of Pacific Union’s Bay Area regions, as well as the Tahoe/Truckee area.
Month-over-month home price changes, meanwhile, varied from region to region. Single-family home prices topped $1.2 million in San Francisco – a one-year high – while prices in our Contra Costa, East Bay, and Tahoe/Truckee regions were also on the uptick.
Click on the image accompanying each of our regions below for an expanded look at local real estate activity in October.
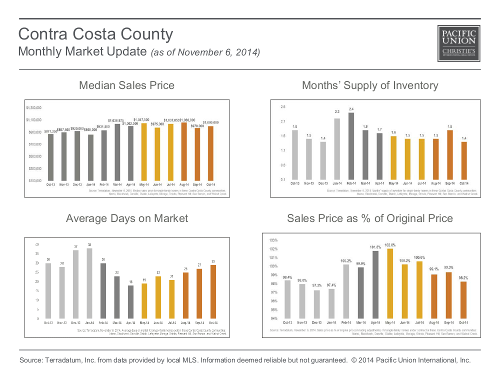
CONTRA COSTA COUNTY
The median home sales price in our Contra Costa County region hit seven digits for the sixth month this year in October, landing squarely at $1,000,000. The months’ supply of inventory (MSI) dropped to 1.4, the lowest level since December.
The pace of sales in the Contra Costa market has been slowing a bit each month since July, and in October homes stayed on the market for an average of 29 days, two days longer than in the preceding month. Buyers fetched an average of 98.2 percent of original price, almost identical to numbers recorded one year earlier.
Defining Contra Costa County: Our real estate markets in Contra Costa County include the cities of Alamo, Blackhawk, Danville, Diablo, Lafayette, Moraga, Orinda, Pleasant Hill, San Ramon, and Walnut Creek. Sales data in the adjoining chart includes single-family homes in these communities.
EAST BAY
With less than one month’s supply of homes for sale, the East Bay remains one of the Bay Area’s most challenging and competitive markets for homebuyers. The median price reflected the lack of homes on the market, rising to $840,000 and nearly matching its one-year highs.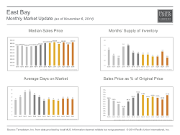
Buyers took an average of 22 days to close a purchase, almost identical to what we’ve seen since the spring. East Bay sellers enjoyed premiums of 11.5 percent more than original price, the most in any of Pacific Union’s regions.
Defining the East Bay: Our real estate markets in the East Bay region include Oakland ZIP codes 94602, 94609, 94610, 94611, 94618, 94619, and 94705; Alameda; Albany; Berkeley; El Cerrito; Kensington; and Piedmont. Sales data in the adjoining chart includes single-family homes in these communities.
MARIN COUNTY
After reaching a one-year peak in September, the median home price relaxed in our Marin County region in October, falling to $977,000. The MSI, which also spiked in September, fell to 1.7, similar to what we observed in the summer.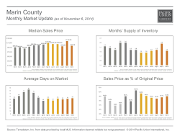
Home sold in an average of 54 days, almost identical to last October’s reading. On average, sellers received slightly less — 98 percent – than their original price.
Defining Marin County: Our real estate markets in Marin County include the cities of Belvedere, Corte Madera, Fairfax, Greenbrae, Kentfield, Larkspur, Mill Valley, Novato, Ross, San Anselmo, San Rafael, Sausalito, and Tiburon. Sales data in the adjoining chart includes single-family homes in these communities.
NAPA COUNTY
Napa County’s median sales price, which has been zigzagging from month to month for the entire year, declined to $535,000 in October. Buyers got a bit more of a discount than they have in the past couple of months, paying an average of 92.4 percent of original price.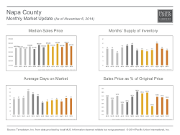
After moving toward a more balanced state in the late summer, the MSI in Napa County now looks to favor sellers again, as it declined to 3.5 in October. Homes took an average of about three months to sell, just as they did in September.
Defining Napa County: Our real estate markets in Napa County include the cities of American Canyon, Angwin, Calistoga, Napa, Oakville, Rutherford, St. Helena, and Yountville. Sales data in the adjoining chart includes all single-family homes in Napa County.
SAN FRANCISCO – SINGLE-FAMILY HOMES
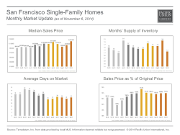
The median price for a single-family homes in San Francisco reached a one-year pinnacle of $1.2 million in October. Homebuyers in the city continue to pay hefty premiums to secure their dream properties, with houses selling for an average of 10 percent above asking price.
San Francisco’s MSI dropped to 1.2 in October, the lowest it has been in 2014. Homes left the market in an average of 29 days, consistent with what we’ve seen since the spring.
SAN FRANCISCO – CONDOMINIUMS
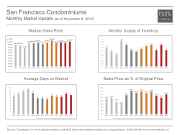
The median San Francisco condominium price topped the $1 million mark for the second time this year in October. As has been the case in every month since February, sellers shelled out more than original price to land a purchase, in this case, an average of 6 percent.
The MSI dropped back to 1.3 in October after rising slightly September. Condominiums left the market in an average of 36 days, three days faster than in the preceding month.
SILICON VALLEY
Homes in our scorching Silicon Valley region have been selling for more than $2.4 million since March, and that didn’t change in October, with the median sales price at $2,431,750. Prices didn’t damper buyer enthusiasm, as the MSI declined to 1.0, the lowest level recorded in the past year.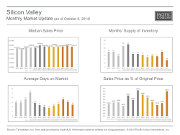
The pace of home sales has been picking up since August, and in October buyers took an average of 25 days to purchase a property. Sellers in Silicon Valley received an average of 6 percent more than original price, they largest premiums since the spring.
Defining Silicon Valley: Our real estate markets in the Silicon Valley region include the cities and towns of Atherton, Los Altos (excluding county area), Los Altos Hills, Menlo Park (excluding east of U.S. 101), Palo Alto, Portola Valley, and Woodside. Sales data in the adjoining chart includes all single-family homes in these communities.
Mid-Peninsula Subregion
Besides the East Bay, our Mid-Peninsula subregion was the only other Pacific Union market with less than one month’s supply of inventory. The median sales price in the region was $1,305,000, a slight decline from September but in the same general area it has been since the middle of summer.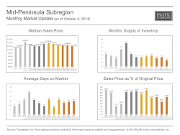
Homes sold in an average of 30 days, two days longer than in September. Sellers took home an average of 1.4 percent above asking price, a bit more than they did in the previous month.
Defining the Mid-Peninsula: Our real estate markets in the Mid-Peninsula subregion include the cities of Burlingame (excluding Ingold Millsdale Industrial Center), Hillsborough, and San Mateo (excluding the North Shoreview/Dore Cavanaugh area). Sales data in the adjoining chart includes all single-family homes in these communities.
SONOMA COUNTY
Home prices took a slight month-over-month dip in Sonoma County, but not much of one; October’s median sales price of $485,000 is just $11,000 lower than it was in September.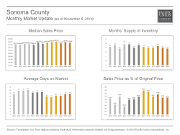
The MSI dipped to 2.0, a 2014 low. The average Sonoma County property sold for 96.6 of its original price, unchanged from September. Homes sold in an average of 68 days, one day quicker than in the preceding month.
Defining Sonoma County: Our real estate markets in Sonoma County include the cities of Cotati, Healdsburg, Penngrove, Petaluma, Rohnert Park, Santa Rosa, Sebastopol, and Windsor. Sales data in the adjoining chart includes all single-family homes and farms and ranches in Sonoma County.
SONOMA VALLEY
As in Sonoma County, the median home price took a barely noticeable dip in Sonoma Valley from September, falling to $569,500. The number of homes for sale in the region has been dropping since April, and October’s 2.0 MSI is the lowest it has been in the past year.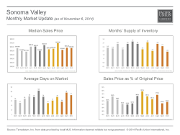
Homes took an average of 85 days to leave the market, with sellers receiving an average of 93.3 percent of original price, a small bump up from September.
Defining Sonoma Valley: Our real estate markets in Sonoma Valley include the cities of Glen Ellen, Kenwood, and Sonoma. Sales data in the adjoining chart refers to all residential properties – including single-family homes, condominiums, and farms and ranches – in these communities.
TAHOE/TRUCKEE – SINGLE-FAMILY HOMES
The median sales price for a single-family home rebounded a bit from September to October in our Tahoe/Truckee region to close the month at $607,342. Inventory has been steadily dropping since July in anticipation of ski season, and October’s MSI of 5.6 marks a 2014 low.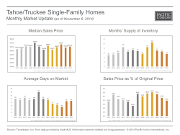
Single-family homes in the region sold in an average 89 days, nearly identical to September’s reading. Sellers in the region have been getting a progressively smaller percentage of original price since the middle of summer, and in October, homes sold for an average of 91.9 percent of their original price.
Defining Tahoe/Truckee: Our real estate markets in Tahoe/Truckee include the communities of Alpine Meadows, Donner Lake, Donner Summit, Lahontan, Martis Valley, North Shore Lake Tahoe, Northstar, Squaw Valley, Tahoe City, Tahoe Donner, Truckee, and the West Shore of Lake Tahoe. Sales data in the adjoining chart includes single-family homes in these communities.
TAHOE/TRUCKEE – CONDOMINIUMS
The median sales price for a winter-getaway condominium in the Tahoe/Truckee region has been on the uptick since the late summer and reached $416,000 in October. Condominium inventory in the region also saw a drop-off; at 6.0, the MSI was the lowest since last October.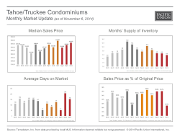
Still, condominium shoppers in Tahoe/Truckee appear to still have some negotiating room, with properties selling for an average of 89 percent of original price. The pace of condominium sales picked up from September, although properties still took an average of about five months to sell.
Defining Tahoe/Truckee: Our real estate markets in Tahoe/Truckee include the communities of Alpine Meadows, Donner Lake, Donner Summit, Lahontan, Martis Valley, North Shore Lake Tahoe, Northstar, Squaw Valley, Tahoe City, Tahoe Donner, Truckee, and the West Shore of Lake Tahoe. Sales data in the adjoining chart includes condominiums in these communities.