For many prospective buyers in the Bay Area, location is the key factor driving a home purchase, whether it’s to live near the office, within the boundaries of a certain school district, or in close proximity to family and friends. 
For others, however, a home’s size may be of particular importance – especially for growing families who want to upgrade their space or empty-nesters who no longer need a sprawling house in the suburbs.
We took a look at October MLS data as of Nov. 18 to determine the average price per square foot for single-family homes in our Bay Area regions, as well as towns and cities where buyers paid the most and least for the average amount of space.
We also assembled a list of the 10 most expensive and affordable cities in terms of square footage; scroll down to see the charts.
CONTRA COSTA COUNTY
In October buyers paid an average of $384 per square foot across Contra Costa County, a year-over-year increase of 16 percent.
Homes in Martinez are the most affordable in Contra Costa in terms of square footage, an average of $277 – 28 percent cheaper than the county average. At $280 per square foot, Concord was the only other city in the region under $300 per square foot.
On the other side of the spectrum were Diablo ($574 per square foot) and Lafayette ($514 per square foot) – the two Contra Costa cities where buyers paid the most for space.
EAST BAY
Buyers in our East Bay region shelled out an average of $452 per square foot in October, also a yearly gain of 16 percent.
At $369 per square foot, homes in El Cerrito were the most affordable in the East Bay, 18 percent less expensive than those in the entire region. Homes in Piedmont, meanwhile, ran $615 per square foot, 27 percent higher than in the rest of the region.
MARIN COUNTY
With an average home sales size of 2,185 square feet in October, Marin County properties were the second largest in our eight Bay Area regions. Buyers paid an average of $531 per square foot, 20 percent more than they did a year ago.
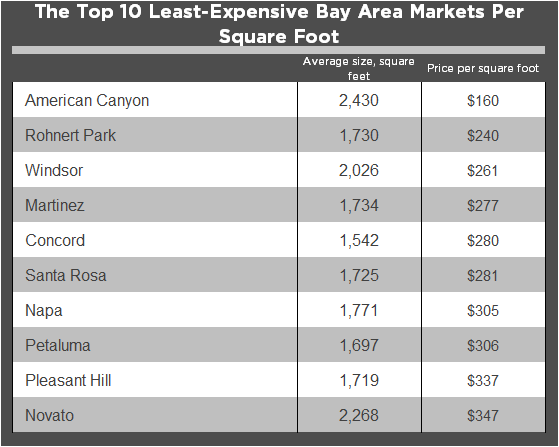
Novato was the only Marin County city where homes cost less than $400 per square foot: $347. Homes in San Rafael, Greenbrae, and Fairfax sold for between $435 and $473 per square foot.
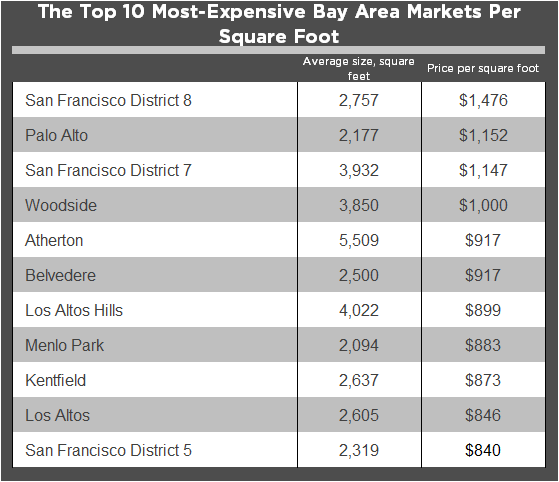
In Belvedere, meanwhile, buyers paid an average of $917 per square foot – 42 percent higher than in the rest of the county. Still, it was a substantial price drop from September, when homes sold for $1,410 per square foot.
NAPA COUNTY
In October, the average price per square foot for a Napa County home was $330, short of its 12-month July high but up a bit from the previous month.
Homes in American Canyon boasted the lowest price per square foot of any city, town, or district that we examined — $160. American Canyon was the only city in the Bay Area where the price per square foot was below $200.
On the top end, buyers in St. Helena forked over an average of $729 per square foot in October, 55 percent higher than the county average.
SAN FRANCISCO
With an average price of $737 per square foot, homes in San Francisco sold for 17 percent more than they did last October, when the average price per square foot was $610.
Single-family homes in District 8, which includes the neighborhoods of North Beach, Russian Hill, and Telegraph Hill, were the priciest in the Bay Area in terms of square footage: a whopping $1,476. Homes in District 7, which includes Pacific Heights and Presidio Heights, also broke the $1,000-per-square-foot mark, at $1,147.
San Francisco home hunters seeking the most size per buck should perhaps focus on District 10 in the city’s southeastern corner, where the average price per square foot was $446.
SILICON VALLEY
Our Silicon Valley region showed the largest overall per-square-footage numbers in October, both in terms of average size (2,722) and average price ($946).
Although homes in Palo Alto were an average of 20 percent smaller than those in the rest of Silicon Valley, they commanded $1,152 per square foot: the highest in the region and the second most in the Bay Area. Homes in Woodside sold for exactly $1,000 per square foot in October, fourth highest in the Bay Area.
Homebuyers seeking the most space per dollar should investigate Portola Valley: at $680 per square foot, homes are 28 percent cheaper than the Silicon Valley average.
SONOMA COUNTY
The average price per square foot in Sonoma County showed the largest year-over-year gains in our Bay Area regions, at 21 percent. In October, the average price per square foot was $317, a 12-month high.
Rohnert Park and Windsor were the second and third most affordable cities in terms of price per square foot in the Bay Area, at $240 and $261 respectively. Buyers in Healdsburg paid the second most per square foot in Sonoma County, at $490.
SONOMA VALLEY
Homes in our Sonoma Valley region sold for an average of $448 in October, a yearly increase of 17 percent.
At $414 per square foot, homes in Kenwood were the most affordable in Sonoma Valley. Homes in the city of Sonoma cost slightly more per square foot ($434), while those in Glen Ellen were $776, the most in the Wine Country.
(Photo: Flickr: Jeff_Golden)