
Executive Summary:
- Monthly year-over-year appreciation averaged 7 percent throughout the Bay Area in 2016.
- However, price appreciation varied widely, from -6 percent in some cities to almost 20 percent in others.
- Some ZIP codes, particularly those in Oakland and Berkeley, appreciated in excess of 20 percent.
- The median price for homes in cities experiencing depreciation was $1.7 million, which is triple the median price of cities that experienced the highest appreciation.
- Buyer frenzy remained relatively stronger in areas with higher appreciation.
- Affordability and accessibility to jobs and transit are the main drivers of local housing markets.
During Pacific Union’s recent third annual Real Estate and Economic Forecast, presented in partnership with John Burns Real Estate Consulting, we discussed the future of Bay Area housing markets through 2019. In addition to outlining our expectations for the next few years, we reviewed the housing market performances of individual Bay Area cities and how they compare. Following double-digit-percent price appreciation over the previous few years, last year’s home appreciation varied notably across communities. While the monthly year-over-year price growth averaged 7 percent throughout 2016, not all neighborhoods appreciated at the same rate, and some even saw homes selling at a lower price than the year before.
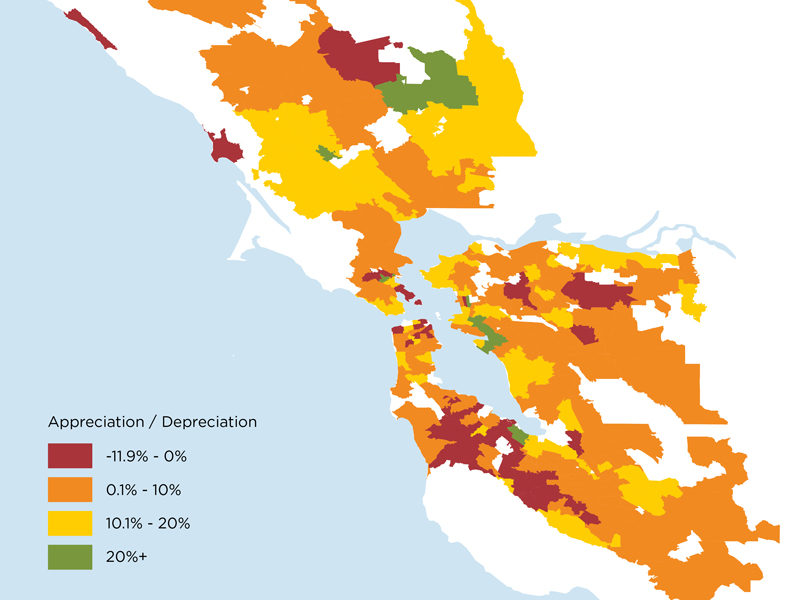
The map below (Figure 1) depicts appreciation rates at the ZIP code level for the year to date (January through October 2016) when compared with the same period in 2015. As the legend in Figure 1 suggests, appreciation rates varied from 12 percent to 40 percent. The red areas indicate ZIP codes where the median price of homes sold between January and October 2016 was lower than the median price during the same period of 2015. The orange, yellow, and green regions experienced some positive rate of price appreciation.
Figure 1: Annual appreciation and depreciation across the Bay Area. Only ZIP codes with 30 or more transactions in 2016 are included in the analysis.

The majority, or 54 percent, of ZIP codes appreciated up to 10 percent; 26 percent of ZIP codes appreciated between 10 and 20 percent; and 6 percent appreciated above 20 percent. Fourteen percent of ZIP codes depreciated, representing 11 percent of the total transactions in 2016. It’s important to note that the areas where the median price was lower this year generally experienced a relatively larger decrease in the share of listings that sold over the asking price when compared with last year. Also, those areas had lower premiums that buyers were willing to pay over the asking price than in 2015. It appears that the intense buyer competition that permeated Silicon Valley markets in 2015 led to buyer fatigue this year, with fewer home shoppers willing to engage in bidding wars (more on that trend below).
The following three tables summarize the cities in which the median price fell (Table 1), cities with up to 10 percent appreciation (Table 2), and cities with appreciation rates higher than 10 percent (Table 3). While the ZIP code appreciation varied relatively more, when grouped by cities, appreciation rates had a smaller variation yet still ranged from -6 percent to 19 percent. Only cities with at least 100 transactions in 2016 are included in the tables.
Table 1

Table 2

Table 3

There are a few interesting trends worth noting. In cities where the median price fell, the average median price was higher at $1.7 million, which is triple the median price of cities with appreciation rates in excess of 10 percent – where the median price averaged $511,000. Most of the declining areas are located in Santa Clara and San Mateo counties. Interestingly though, two adjacent cities, Palo Alto and East Palo Alto, ranked on the complete opposite sides of the appreciation spectrum, with Palo Alto prices declining by 6 percent and East Palo Alto properties appreciating by 19 percent. The variation of price changes highlights Silicon Valley’s underlying problem: a lack of affordability. In other words, while a lack of affordability and a shortage homes for sale has slowed the market in Silicon Valley, demand for affordable options remains strong. Additionally, while fewer homes were selling over the asking price and at a smaller premium generally in the Bay Area, Palo Alto and East Palo Alto experienced different drops in buyer frenzy. East Palo Alto had a smaller decrease in the share of listings selling over the asking price and a smaller decrease in the premium paid.
In fact, the contrasting trend is true for the whole Bay Area. Figure 2 illustrates the correlation between price appreciation (on the X axis) and the percentage-point change in the share of transactions selling over the asking price between 2015 and 2016 (on the Y axis). The upward sloping trend line suggests a positive relationship between the two variables. In other words, ZIP codes that saw higher rates of appreciation also had a higher share of homes selling over the asking price this year when compared with 2015. However, homes in these “hot” neighborhoods did not only sell more frequently above the asking price but also at a higher premium. Figure 3 illustrates the correlation between price appreciation (on the X axis) and the percentage point change in premium paid over the asking price between 2015 and 2016. The positive correlation, though weaker, still suggests that areas with higher appreciation had a smaller decline or even an increase in the premium paid.
Figure 2: Correlation between appreciation and change in the share of homes selling over asking price

Figure 3: Correlation between appreciation and change in premium paid

Lastly, while affordability is one of the main determinants of the Bay Area housing market’s performance, accessibility to job centers and transit also appears to fuel some of the price increases. For example, among the 13 ZIP codes with the highest appreciation rates, ranging from 20 to 40 percent, eight were located on the eastern side of the Bay Bridge — six in Oakland and two in Berkeley.
Going forward, there are many unknowns — not just for Bay Area markets, but for the housing market in general. The health of the Bay Area’s economy and strong demographic fundamentals suggest that the housing market still has a lot of steam left, though the policy decisions implemented by the incoming Trump administration will weight notably on the future. Nevertheless, affordable inventory of homes is in demand, and with the inventory of homes priced below $1 million decreasing 11 percent from 2015, supply may indeed remain the region’s biggest challenge.
To watch a video of Pacific Union’s full one-hour Real Estate and Economic Forecast, click here.
Selma Hepp is Pacific Union’s Chief Economist and Vice President of Business Intelligence. Her previous positions include Chief Economist at Trulia, senior economist for the California Association of Realtors, and economist and manager of public policy and homeownership at the National Association of Realtors. She holds a Master of Arts in Economics from the State University of New York (SUNY), Buffalo, and a Ph.D. in Urban and Regional Planning and Design from the University of Maryland.