Last Friday’s economic news put a damper on prospects for a robust national recovery. With lower-than-expected domestic job creation and a slight increase in unemployment, combined with equity market sell-offs and uncertainty in the eurozone, the national media immediately sounded broad-based alarms.
While the news from Washington may have seemed bleak, the truth is that the San Francisco Bay Area is thriving on its own regional economic drivers.
Our research at Pacific Union International suggests that, especially when it comes to the residential real estate industry, our markets continue to benefit from record-high demand and both seasonally and historically low inventory. Since February, we have been encouraging home sellers to join the party.
Here are positive economic indicators that drive our markets – and paint a fundamentally stronger picture of the real estate market.
- More jobs fuel the economy’s engine. The Bay Area economy is improving significantly faster than the rest of the country. In April, San Francisco’s unemployment rate was 7.4 percent – down a significant 3.5 percentage points from the statewide average of 10.9 percent, and down 0.7 percentage point from the U.S. average of 8.1 percent. Marin County’s numbers were even better, with an unemployment rate of 6.4 percent – the lowest in California. The six Bay Area counties served by Pacific Union International’s real estate professionals consistently post stronger employment numbers than any other region in California. This drives consumer confidence and residential real estate demand.
- Home sales are booming. Bay Area home sales are setting new high-water marks, with April up 9.2 percent compared with April 2011. In fact, we’ve already projected, based on our Q1 results, that 2012 sales will exceed the 10-year average in the Bay Area for the first time since 2005. The number of homes on the market is down as prices move up. We believe the market is changing with a velocity we haven’t seen since its collapse in September 2008.
- Mortgages are “on sale” at historically low rates. Treasury rates hit record lows last week, with the 30-year Treasury bond’s interest rate falling to 2.54 percent and the benchmark 10-year Treasury note hitting a low of 1.46 percent. Average U.S. rates on 30-year and 15-year fixed mortgages dropped to record lows with the 15-year loan dipping below 3 percent for the first time ever, according to Freddie Mac. That means it’s more affordable than ever to finance a home – and there are significant financial benefits to buying rather than renting a home.
- It’s a seller’s market. Demand is outstripping inventory in the Bay Area regions Pacific Union International serves, a trend that’s echoed in Silicon Valley. Once again, it’s time for sellers to join the party.
- Foreclosures are fewer. Foreclosure rates continue to drop around the Bay Area. In April, the last month for which data was available, default notices fell more than 9 percent from March in Santa Clara County, 24 percent in San Mateo County, 21 percent in Contra Costa County, and 25 percent in Alameda County.
- And don’t forget Facebook. The IPO may not have lived up to the hype, but it will still mint plenty of millionaires. And Facebook will create huge boosts for the tech industry, the local economy, and of course, real estate. Silicon Valley is seeing soaring housing prices, and the trickle-up effect will benefit San Francisco and other Bay Area cities – not to mention the Sonoma and Napa County wine country and Lake Tahoe second-home and vacation-rental markets.
Here are a few positive internal indicators driving a vibrant outlook from Pacific Union International. Our view is that the Bay Area economic recovery is healthy and as a result, our local real estate markets are thriving.
We’re constantly reminded that real estate is local – and you can’t assume that national trends apply to our neighborhoods.
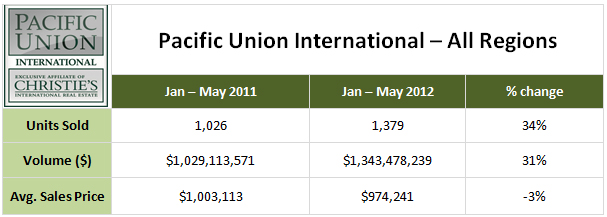
Pacific Union International Sales Data (All Regions)
The table above illustrates significant and sustainable housing demand up over 30 percent year-over-year. Multiple offers are contributing to stable pricing. Units sold are significantly higher in Sonoma (Santa Rosa) and Contra Costa counties, which resulted in the modest overall decrease in average sales price.
Pacific Union International New-Escrow Trends (All Regions)
- The 26-week average increased year-over-year (trailing 12 months May 2012 vs. trailing 12 months May 2011) by 25.7 percent in unit volume and 23.5 percent in dollar sales volume.
- The 10-week average increased year-over-year (trailing 12 months May 2012 vs. trailing 12 months May 2011) by 17.5 percent in unit volume and 10.5 percent in dollar sales volume.
It’s interesting to note the significant increases in the 10-week averages through March and April exceeded the prior year averages in both units and sales volume by 30 to 40 percent overall.
These 10-week averages have held very steady at roughly 75 to 80 new escrow units per week and $70 million to $80 million in new-sales volume per week. Both are very positive leading indicators of sustained growth.
This equates to 10 percent or less in change/variance over the last 90 days. Our volume continues to be stable and consistently strong year over year.
 Alameda County* Market Snapshot
- Percent of listings under contract: 47 percent vs. 23 percent in May 2011
- Number of active listings not under contract: 684 vs. 874 in May 2011 (a decrease of 22 percent )
- Average number of new escrows by week for the last 12 weeks: 64
- The trend in new escrows is up, with an average of 74 in the last 4 weeks
Our East Bay cities overall have transitioned from a buyer’s market to one that appears to favor sellers, and multiple offers are driving prices over asking. May sales closed at an average of 104 percent of the list price.
Our real estate professionals report that their buyers are being priced out of the market; however, we cannot document an increase in average or median sales prices. It may simply be the change in expectation when a buyer’s market reverses course.
May showed a dramatic change in the number of new sales for the month — up 34 percent over April and 63 percent over May 2011. As we end May with a one-month supply of inventory, we see buyers tired of competing and would-be sellers waiting for prices to go up.
*Includes single family homes in Oakland ZIP codes 94602, 94609, 94610, 94611, 94618, 94619, 94705 (Piedmont, Berkeley, Albany, Kensington and El Cerrito.)
 Contra Costa County Snapshot
- 46 percent of our listings were under contract in May 2012 (340 of 737) vs. 30 percent one year earlier (229 of 765).
- The average number of new escrows opened for the last 12 weeks was 42, with a high of 65 in the first week of May.
- Average sales price is up almost 12 percent compared with the same time last year ($942,000 vs. $844,000)
Our market area has seen increased sales activity over this same time last year, but new listing inventory is still low. There are multiple offers in the under-$1.2 million range.
Although averages sales prices are up, average list prices are down — $1,150,000 vs. $1,245,000 last year. This means sellers are pricing their homes more realistically, which in turn has spurred an increase in buyer activity. And the percent of homes that expire without selling has dropped in half since last year.
Overall, we’re seeing a much healthier market, but there’s still more demand than supply.
 Marin County Market Snapshot
- We have accelerated from 19 percent of active listings under contract in January to 32 percent at the end of May. Once again, demand aggressively exceeds supply.
- If we look back a year ago, there were 16 percent of homes under contract– making today’s market 50 percent better than 12 months ago.
- Our inventory of properties for sale has dropped to 1.9 months’ supply from 4.7 months’ supply one year ago.
The Marin County market continues to show strong momentum, although inventory continues to be constrained and the multiple offers we see reflect a strong buyer presence in the market.
 Napa County Market Snapshot
- 48 percent of current listings are under contract
- The number of available listings – those not under contract — is shrinking, down 31 percent compared with the same period in 2011 (723 available listings, down from 1043 last year). The best properties in all price ranges continue to sell in record time.
- The average number of new escrows by week for the last 12 weeks is almost 30 percent higher than for the previous 12 weeks. We see this phenomenon continuing to trend up.
- Properties in Napa County under $500,000 continue to generate multiple offers and many trade over the asking price.
There are a significant number of buyers at the sub-$500,000 price point but little inventory for sale. The high end, over $2 million, and the second-home markets have been very robust for the last 8 months after languishing for the previous 18 months.
Wineries and vineyard land are once again in high demand by local, regional, and international buyers.
The historically low interest rates are a driving force in the lower end of the market, while realized value is driving the upper end with the majority of these properties being all-cash transactions.
 San Francisco Market Snapshot
- The number of properties for sale in May was 35 percent lower than one year earlier (1,758 vs. 2,706).
- 41.6 percent of properties on the market in May were in contract with a buyer — nearly twice the percentage one year earlier.
- The average days on market before a property goes into contract has dropped, year-over-year, from 69 days to only 38.
The San Francisco real estate market continues to defy the national trends and is nearly as robust as the market in 2005. We continue to see tight inventories in nearly every category (homes, condominiums, co-ops, tenancies-in-common, and units) and in every neighborhood.
There should be no confusion over the fact that we are currently experiencing a seller’s market in San Francisco. The speed at which sales are taking place is impressive, but this is to be expected in an inventory-constrained, buyer-rich market. Buyers should get financing in place and be prepared to move quickly.
 Sonoma County Market Snapshot
- Percent of single-family homes under contract: 37 percent in May 2012 vs. 16 percent in May one year earlier.
- Number of active listings not under contract: 1,676 vs. 2,631 last year (a decrease of 36 percent).
- Average number of single-family homes going under contract over the last 12 weeks is 142 — and the number is steadily increasing by 10 percent per month.
Multiple offers are the rule for reasonably priced properties in Sonoma County, and there is strong activity now in the move-up price ranges north of $500,000 up to $2 million. Inventory is the limiting factor in this market; we are currently at a 1.5-month supply of inventory.
 Sonoma Valley Market Snapshot
- The average number of properties going under contract in the last 12 weeks has improved over the previous 12 weeks by almost 54 percent.
- The number of closed sales has improved by 20 percent over the same period.
- The median price of under-contract properties shows a mere 3.7 percent increase and the closed sales median is actually down by 16.7 percent in the same 12 week period.
- The number of properties on the market (listings, or supply) continues to be a challenge, running approximately 29 percent below where we were last year at this time.
Short sales and bank-owned foreclosure properties are continuing to make housing purchases affordable; however, we are seeing multiple offers and many offers over the asking prices in the lower end of the market, which continues to lift pricing from “the bottom” as the recovery continues.
Further Reading
We keep a close eye on the Bay Area economy and have posted several stories on our blog in recent weeks noting the strength of the local economy and real estate markets in contrast with bearish news on the state and national scene:
- Big Jump in April Home Sales, Prices
- Bay Area Homes More Affordable Than Ever
- May Real Estate Market Update
- Multiple Offers Are Back – But With a Twist
- Housing Down? Not In Our Back Yard
- Pacific Union Quarterly Real Estate Report
Here’s a look at other news reports in recent weeks on the economic conditions and the housing recovery:
- Number of Homes on Market Down as Prices Pick Up
- Slowing U.S. Economy Has Ripple Effect in California
- Economists More Upbeat About Job Growth, Housing
- Fallout From Facebook IPO Showers Benefits on All
- Increase in Bay Area Home Sales and Median Price
- Housing and Economic Forecast Brightens
- Foreclosures drop across Bay Area
Image credits:
Downtown San Francisco image courtesy Phillippe L. Photography via Flickr
Alameda County (Berkeley Hills) image courtesy man pikin via Flickr
Contra Costa County (Mt. Diablo) image courtesy 2littlewings via Flickr
Marin County (Sausalito) image courtesy culpfiction via Flickr
Napa County (winery) and San Francisco (Victorians) images courtesy Jack Staub via Flickr
Sonoma County (Santa Rosa River) image courtesy Peter Stetson via Flickr
Sonoma Valley (vineyard) image courtesy gura_eyal via Flickr

