The San Francisco metro area is no longer experiencing the breakneck home price appreciation observed in 2013 and early 2014, but our region still put up the largest gains in the nation last November, according to the latest numbers from a well-known real estate index.
Data from the most recent S&P/Case Shiller Home Price Indices says that single-family home prices in the San Francisco metro area rose by 8.9 percent on an annual basis in November, edging out Miami to take the No. 1 spot on the 20-city list. San Francisco last topped the index in May 2013, according to archived S&P/Case Shiller reports.
Price appreciation in the San Francisco area peaked at 25.7 percent in September 2013 and has gradually tapered off ever since. November marked the fourth consecutive month that year-over-year home price gains were in the single-digit range.
The regional slowdown mirrors cooling home prices nationally. None of the major metro areas included in the report experienced double-digit annual price increases in November, whereas one year earlier 13 of them did. Across the index’s 20-city composite, year-over-year price gains registered 4.3 percent, similar to the 4.7 percent recorded nationwide.
In a statement accompanying the report, David Blitzer, managing director and chairman of the Index Committee at S&P Dow Jones Indices, offered a somewhat pessimistic take on the state of the U.S. housing recovery, calling it “barely on first base.” Still, Blitzer was upbeat about the country’s economic growth and improving unemployment numbers, as well as strong overall consumer confidence.
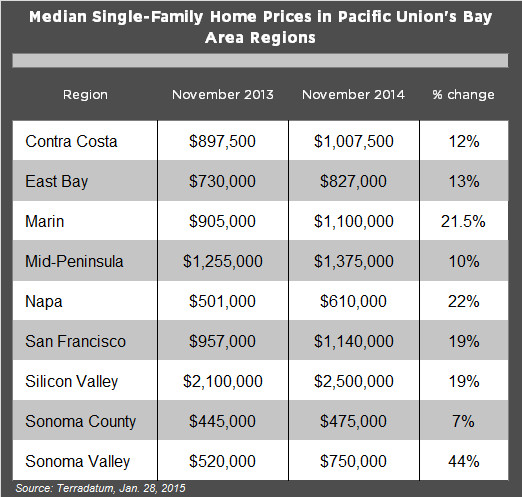
Turning back to the Bay Area, a deeper dive into MLS data shows healthy annual price growth in Pacific Union’s individual Bay Area regions, particularly in parts of the North Bay. The median sales price in Sonoma Valley hit $750,000 in November — a year-over-year increase of 44 percent and tying its two-year high – while both Napa and Marin counties saw gains of more than 20 percent.
Consult the chart below for breakout data for each of Pacific Union’s Bay Area regions. For information on how we define each individual region, please refer to our recent fourth-quarter real estate report.
(Photo: Flickr/Awkwardindeed)