Though median prices in many of our Bay Area markets experienced a slight midsummer cooling from June to July, homes are still in high demand, as low inventory levels and above-list sales prices attest.
However, in some markets, prices continued to climb. Median home prices in Marin County passed the $1 million mark in July and are up 27 percent since January. In Sonoma County, median home prices hit $480,000, an increase of 31.5 percent since the beginning of 2013.
Available properties are still exceptionally slim, especially in San Francisco, where the months’ supply of inventory (MSI) for condos hit its lowest level in the past 12 months. Single-family homes in the city are also hard to come by, with MSI reaching lows we haven’t seen since December. And buyers continued to shell out more than list price in several of our hottest markets, including the East Bay, Contra Costa, and San Francisco.
Click on the images accompanying each of our regions below for an expanded look at real estate activity in July.
CONTRA COSTA COUNTY
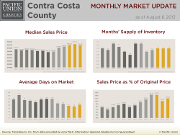
Median home prices declined in Contra Costa County for the first time this year, but only by a slight 4.5 percent from June, ending up at $795,000 in July. Home prices in the county are still 16 percent higher than they were a year ago.
MSI in Contra Costa County was equally as scarce as it was in May and June, holding steady at a 1.3. In a trend that began in March, buyers continued to pay slightly above list price — in this case 1 percent.
Homes stayed on the market for an average of 21 days, a hair longer than they did over the past two months, but still sold 28 percent quicker than they did in July 2012.
EAST BAY
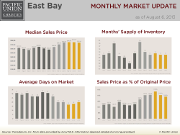
After reaching yearly highs in May, median sales prices took another small drop in the East Bay, to finish at $750,000. That said, prices are down only 2 percent from their levels two months ago.
For the second consecutive month, there was just a 1.1-month supply of homes in the East Bay, among the lowest in all of Pacific Union’s regions. Yet again, a short supply of inventory translated into buyers spending more than list price, this time by an average of 9 percent. At no point during the past year did sales prices ever dip below asking prices.
The average East Bay home was on the market for 20 days, back to levels we saw earlier this spring.
MARIN COUNTY
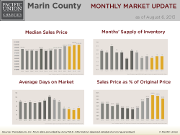
Marin County was one region where median prices continued to head north, breaking the $1 million price point for the first time in the past year, to finish 18 percent above where they stood last July.
The slightly better news for buyers in the region: Sales prices were back to 99 percent of asking prices after being a few fractions of a percentage above for the past two months. Marin County’s 1.8-month supply of homes is at roughly the same level it has been at since March.
Homes sat on the market for an average of 51 days in July, 9 days longer than in June. Still, homes were selling 50 percent quicker than they were in January of this year.
NAPA COUNTY

After notching their yearly peak in June, median home prices in Napa County softened ever so slightly to $518,500. Even so, prices were up a healthy 30 percent from July of last year.
Napa County homes stayed on the market for the longest of any of our Bay Area regions, an average of 81 days. But after a quick spike in June, MSI returned to 2.5 – just about the same as it was in April and May but still tying its yearly low.
On average, homes in Napa County sold for 97 percent of their asking prices in July, a small decrease from the previous month.
SAN FRANCISCO, SINGLE-FAMILY HOMES
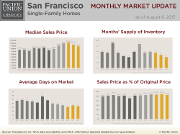
After reaching yearly highs of more than $1 million in April and May, median single-family home prices in San Francisco fell for the second straight month. The current media price of $889,000 is the lowest we’ve seen since February.
As has been the case for all of 2013, buyers in San Francisco continued to fork over more than asking price, in this case 5.5 percent. MSI tied its yearly low of 1.1.
Homes in San Francisco stayed on the market for an average of 33 days, only two days shy of May, when homes sold at their quickest pace in a year.
SAN FRANCISCO, CONDOMINIUMS
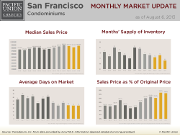
Unlike their single-family-home counterparts, median condominium prices in San Francisco continued to rise in July, hitting $879,000, the second largest in a year. Median San Francisco condominium prices rose 6.5 percent from June to July and 16 percent from July 2012.
With only 0.9 months’ supply of inventory on the market, condominiums in San Francisco are scarcer than they’ve been in a year. This was reflected in the prices buyers paid, which averaged 6.6 percent above list price. Only two months in the past year did average sales prices for San Francisco condominiums fall below asking prices.
The length of time that condominiums stayed on the market was 37 days, identical to June and just a day shorter than May.
SONOMA COUNTY
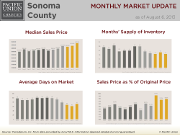
The Sonoma County market is heating up in more ways than one.
Median home prices in Sonoma County reached yearly highs of $480,000, up 31.5 percent from July 2012. Sonoma County home prices have been steadily rising for the past three months.
MSI tied its yearly low of 1.7. And sellers received 98 percent of their asking prices, the second-highest number since July 2012.
Houses stayed on the market for an of average 72 days, 10 days longer than in June but almost a month less than this time last year.
SONOMA VALLEY
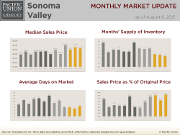
Median Sonoma Valley home prices dipped a bit in July, falling to $532,000, a 5 percent slip from June. Median prices are 36 percent higher than they were a year ago.
With a 1.8-month supply of homes, Sonoma Valley is currently experiencing its lowest inventory levels in a year; the MSI is 54 percent lower than it was in July 2012. Not surprisingly, buyers also received the highest percentage of asking prices in the past year, at 98.7 percent.
Sonoma Valley homes sold in an average of 70 days, 17 days longer than in June, when sales time reached a yearly low.
TAHOE/TRUCKEE, SINGLE-FAMILY HOMES
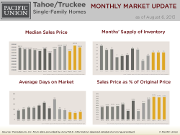
After reaching yearly highs in June, median single-family home prices in our Tahoe/Truckee region dropped to $495,000 in July, only about 1 percent higher than what they were a year ago.
On average, sales prices averaged 95.2 percent of original prices, almost exactly the same levels as the two previous months and the second highest they have been in a year. Homes sold after an average of 75 days of the market, 11 days longer than in June but 62 percent faster than in February, when sales were at their most sluggish.
The Tahoe/Truckee region has a 5.6-month supply of inventory of single-family homes, identical to May and June totals.
TAHOE/TRUCKEE, CONDOMINIUMS
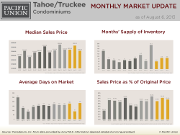
Median condominium prices in our Tahoe/Truckee region dipped to $308,000, down 20 percent from June and the lowest they’ve been since January.
Condominiums languished on the market in July for 186 days, 51 percent longer than the previous month but roughly the same as sales times as in May. Tahoe/Truckee currently has an 8.8-month supply of condominium inventory, unchanged from June.
Sales prices landed at 93.1 percent of list prices, within 2.4 percent of their yearly peaks.