
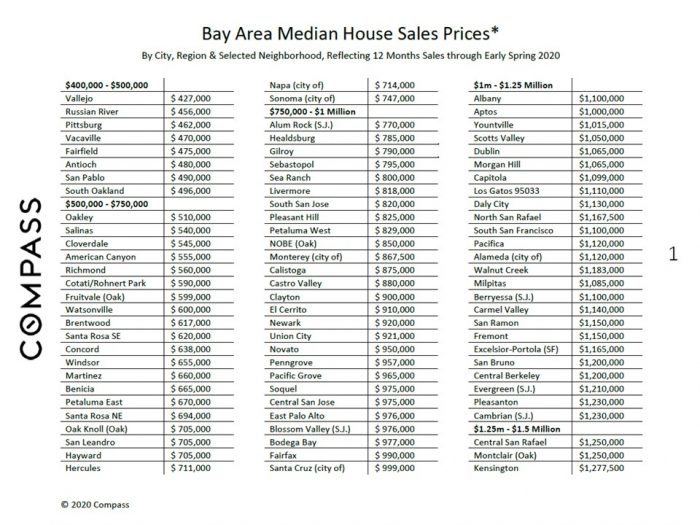
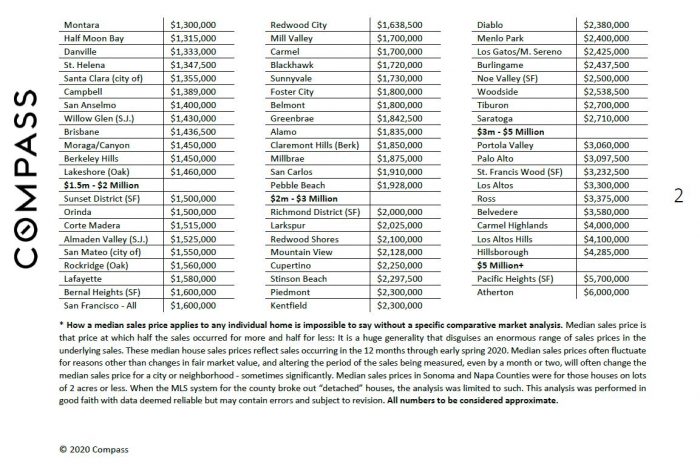
Median home sales prices for every Bay Area neighborhood
This map generally reflects approximate median house sales prices around the greater San Francisco Bay Area for the 12-month period through mid-March 2020 (i.e. before the Coronavirus could affect sales prices). Median sales prices are generalities that often fluctuate and can be affected by other factors besides changes in fair market value. They typically disguise a huge range of prices in the underlying individual sales, and how these median sales prices relate to any particular home is impossible to say without a specific comparative market analysis. Data per sales reported to MLS, deemed reliable, but may contain errors and subject to revision.
Home prices for Santa Cruz and Monterey County cities can be found by choosing the icon at the very bottom of this map.
Run cursor over map to pull up icons and median house sales prices.

Source: Bay Area Market Reports
Median Home Sales Prices through Spring 2020
All our real estate market reports can now be found here:
San Francisco Bay Area Real Estate Market Reports – Compass
Courtesy of Patrick Carlisle