We have been pleasantly surprised by the pace of our real estate markets in most of the regions served by Pacific Union International as we move into the second quarter of 2012 – and we’re projecting even better things to come for the rest of the year.
Even with inventory (listings) down compared with the same period last year, buyer demand drove an increase in the number of homes sold in Q1 in all our regions. If this trend continues, the total number of homes sold this year could reach 20,850 – and exceed the 10-year average in the Bay Area for the first time since 2005.
Take a look at the chart below that describes single family homes sold in the Bay Area. (For more detail, click here to view a chart showing all first-quarter activity in top cities over the past 10 years.)
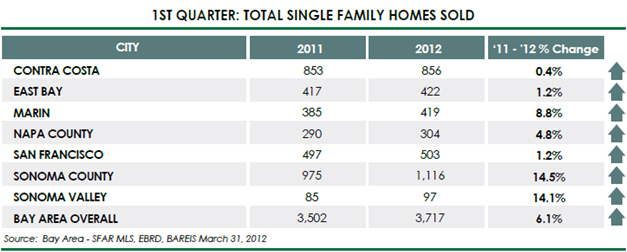
What does this mean? We think the market is changing with a velocity we haven’t seen since its collapse in September 2008. There are a number of positive economic factors supporting this assumption:
- There is healthy growth in new, quality jobs (a strong indicator for our real-estate markets): The Center for Continuing Study of the California Economy expects annual job growth to exceed 200,000, especially in San Francisco, Silicon Valley, and in the East Bay.
- The Conference Board’s index of leading economic indicators, which predicts economic conditions for the next 3-6 months, rose 0.7% in February after a 0.2% increase in January ’12.
- Buyer activity in the market, open house traffic, and multiple offers seem to be increasing exponentially.
- Historically low interest rates (money is “on sale”) continue to have a positive influence on median- and average-priced homes – but more importantly, a positive impact on the “move-up” buyer, which can provide stimulus to the upper end of the market.
For the rest of 2012, we look for continued confidence in Bay Area jobs, as well as additional liquidity generated by technology and social media IPOs and hiring – all contributing to an accelerating real estate market.
Here are some specifics on what’s happening across our various regions. For full details, please click through to the complete quarterly report associated with each area.
CONTRA COSTA COUNTY
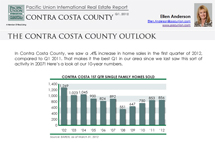
In Contra Costa County, we saw a small 0.4% increase in home sales in the first quarter of 2012, compared with Q1 2011.
However, with continued positive movement, we expect to see around 6,400 sales in 2012 – our best year overall since 2005.
Other Contra Costa County highlights:
- We are still seeing constrained inventory (more buyers than sellers) in the 24/680 corridor, and we expect the second quarter will continue to show pent-up demand from buyers as well as multiple offers on well-priced homes.
- Lamorinda continues to be more competitive than the other areas we cover, due to less turnover and fewer homes to sell given the smaller population.
- We predict Blackhawk will continue to sell well, since for the first time those prices are in line with homes for sale outside the gated community.
See our full Contra Costa County Q1 report for more details, charts, and in-depth information.
EAST BAY
Our projections indicate we’ll likely see around 2,290 home sales in 2012, which will make it our best year since 2006.
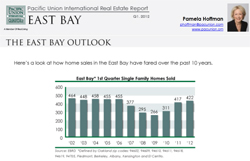
While our Q1 results showed only a modest increase of 1.2% above the same time period last year, we attribute this not to a sluggish market but a lack of inventory.
Other East Bay highlights:
- More than two-thirds of our first quarter sales involved multiple offers, and there have been weeks when the number of new homes going into contract has exceeded the number of new listings.
- The number of pending sales in March 2012 was up more than 50 percent over March 2011 and 2010, and there is only a one-month supply of listing inventory.
- However, price stabilization, pent-up demand, and increasing consumer confidence suggest that an increase in new inventory is not far off.
See our full East Bay Q1 report for more details, charts, and in-depth information.
MARIN COUNTY
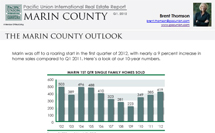
Marin was off to a roaring start in the first quarter of 2012, with a nearly 9 percent increase in home sales compared with Q1 2011.
All indications are that this white-hot activity will continue throughout 2012, which means we’d be looking at about 2,210 homes sold — our best year since 2005.
Other Marin County highlights:
- There is fierce competition out there. In Q1, we saw 43 sales draw multiple offers, ranging from two to 13 bids.
- Mill Valley continues to be the epicenter of activity, with 16 multiple-offer transactions in that city alone.
- Inventory is still tight, but based on the activity our stagers and photographers are seeing, we expect a substantial number of new listings will hit the market in the coming weeks and months.
See our full Marin County Q1 report for more details, charts, and in-depth information.
NAPA COUNTY
We saw 304 homes sell in Napa Valley in the first quarter of 2012, a slight uptick from last year at this time but, more importantly, the continuation of a steady trend of increasing Q1 sales.
Based on this, we are looking for 1,400 homes sold in 2012 – which will make it the best year in Napa since 2005.
Other Napa County highlights:
- In the southern end of Napa County, the City of Napa and American Canyon, most properties listed under $500,000 are generating multiple offers. We feel this price point has hit bottom and is on the upswing.
- The northern end of the valley, especially St. Helena, continues to climb in desirability. We saw a 45% increase in Q1 sales compared with this time last year.
- Single-family homes at Silverado Country Club and Resort are seeing a resurgence in sales, and the Napa Valley is once again being sought after by second-home buyers in all price points.
See our full Napa County Q1 report for more details, charts, and in-depth information.
SAN FRANCISCO
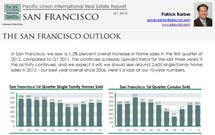
In San Francisco, we saw a 1.2% percent overall increase in home sales in the first quarter of 2012, compared with Q1 2011.
This continues a steady upward trend for the last three years; if the activity continues, and we expect it will, we should see around 2,605 single-family home sales in 2012 – our best year overall since 2006.
Other San Francisco highlights:
- Specific price points are seeing accelerated activity; for example, single-family home sales in the $1 million to $3 million range were up 5 percent, while the $3 million+ market saw a 9 percent jump.
- Condominium sales have been particularly robust; unit sales in the $1-2 million range were up 29 percent, while the $2 million+ market was up 30 percent.
- Median prices of condos are on the rise; we saw 14% increases in NoPa, Hayes Valley, and lower Pacific Heights.
See our full San Francisco Q1 report for more details, charts, and in-depth information.
SONOMA COUNTY
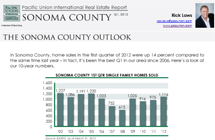
In Sonoma County, home sales in the first quarter of 2012 were up 14 percent compared with the same time last year – in fact, it’s been the best Q1 in our area since 2006.
We anticipate robust sales in 2012 – unless we are limited by a lack of inventory, which has been a recurring issue in the past months.
Other Sonoma County highlights:
- Our purchase contracts are exceeding new listings, and multiple offers have been the rule rather than the exception.
- Three price ranges – below $99,000, $600,000-$699,999, and over $4 million – are seeing double-digit percentage increases in the number of homes under contract.
- We are also seeing a significant increase in purchase contracts ratified on short-sale properties.
See our full Sonoma County Q1 report for more details, charts, and in-depth information.
SONOMA VALLEY
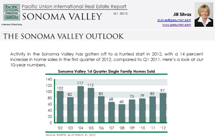
Activity in the Sonoma Valley has gotten off to a hurried start in 2012, with a 14 percent increase in home sales in the first quarter of 2012, compared with Q1 2011.
If the trend continues, we’d be looking at about 505 homes sold in 2012, which makes it the best year since 2005.
Other Sonoma Valley highlights:
- Our biggest issue is low inventory in all price ranges. We are seeing multiple offers on most properties in the under-$500,000 price range and on many properties over $1 million.
- The over-$1 million market is as brisk as we have seen in a long time. One property we listed at $1,300,000 saw four offers in its first week on the market.
- A combination of rising rents, low interest rates, and affordable financing have created an outstanding opportunity to purchase a home as a long- or even short-term rental (like a vacation or second home).
See our full Sonoma Valley Q1 report for more details, charts, and in-depth information.
