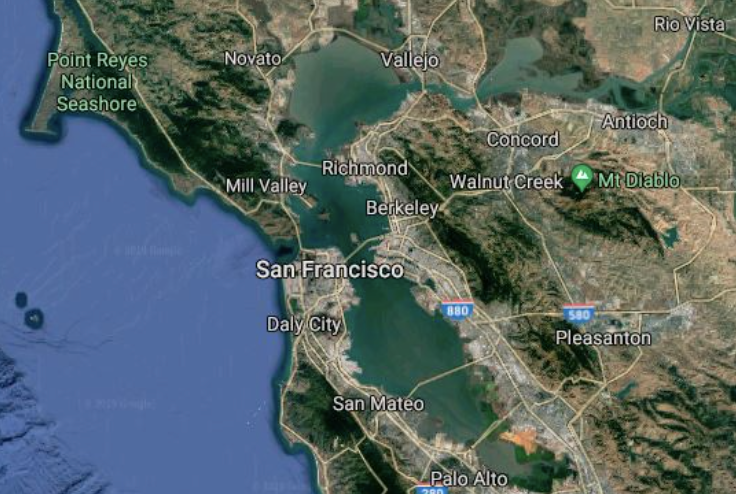
The below San Francisco Bay Area Median House Price Map is offered courtesy of Patrick Carlisle.
The below map and the list of individual markets following are based upon house sales in 2020 as reported to MLS: Median house sales prices and median house dollar per square foot values are indicated (and on the list, median house sizes too). Median value is that at which half the sales occurred for a higher value and half the sales occurred for a lower value. It is a very general statistic, effectively a “summary” of typically large numbers of sales of homes of widely varying values, sizes, conditions and locations. Many, many factors go into home values, and how these median values apply to any particular home is unknown without a specific comparative market analysis.
All things being equal – which they rarely are – a smaller house will sell for a lower price (of course), but a higher dollar per square foot value.
Roll cursor across map to pull up city prices.


