
Executive Summary
- Total home sales in the greater central Los
Angeles area were 2 percent below last May, following April’s upwardly revised
2 percent year-over-year increase.
- Sales between $2 million and $3 million saw a 6 percent jump compared to last May, the first year-over-year increase following six months of double-digit declines, driven by East Valley, Eastern Cities (Arcadia and Monrovia), and Foothill Communities.
- Home sales activity remains relatively stronger on the eastern side of Los Angeles and among homes priced below $1 million – including Eastern Cities, Foothill Communities (La Cañada Flintridge, La Crescenta – Montrose), East Valley (from Sherman Oaks to Glendale), and also South Bay.
- For-sale inventory is up 10 percent
year-over-year, a notable slowing from 20 to 30 percent increases seen during
winter months.
- Relatively larger for-sale inventory growth is seen in western parts of Los Angeles, including Mid City, Sunset East, Silicon Beach, and Brentwood, while inventory is aging without increase in new listings on the East Side, NELA, North Valley, and areas surrounding DTLA – days on market has increased relatively more, up 17 days YOY.
- While demand for homes priced below $1 million remains solid, buyers are taking longer to make the purchase leading to longer days on market, up 7 days YOY to an average of 27 days.
- Absorption of available inventory and the share of homes selling over the asking price improved markedly from winter lows with 36 percent of homes sold over the asking price.
- Home prices remain flat year-over-year with only Eastside, areas surrounding DTLA, South LA, and Mid City seeing an increase of 6 to 8 percent above last year.
- Home price forecast remains flat through 2020.
Detailed Analysis
Following a cheerful housing market activity for Los Angeles in April, May home sales activity slowed some, though still maintaining the momentum gained from the first quarter. Total home sales in the greater central Los Angeles area were 2 percent below last May, following April’s upwardly revised 2 percent year-over-year increase. Encouragingly, the rate of declines has slowed considerably after double-digit declines seen in the first few months of 2019 and 17 months of continual declines.
Overall, Los Angeles housing markets are experiencing an interesting dichotomy with relatively pricier West Side markets continuing to see relative weakness compared to last year and compared to some markets on the Eastern side of the city. Buyers are moderately more active in Eastern Cities (Arcadia and Monrovia), Foothill Communities (La Cañada Flintridge, La Crescenta – Montrose), East Valley (from Sherman Oaks to Glendale), and South Bay, than in Mid-City or West LA areas. The activity is largely driven by more available inventory this spring, but also search for value as much of the activity is seen with homes priced below $1 million, but also within higher price ranges.
Taking the first five months of the year together, sales are 7 percent below last year, with all price ranges trending below last year and a considerable decline in sales of homes above $2 million, which are down 14 percent year-over-year. Nevertheless, May offered some promise for homes priced between $2 million and $3 million with a 6 percent jump compared to last May. This was the first year-over-year increase following six months of double-digit declines. Sales in that price range in May reached the highest level in at least the last four years.
Sales of homes priced below $2 million posted a 2 percent decline from last year, following April’s jump of 5 percent. Even with May’s small decline, the market has seen a considerable improvement in sales compared to an extended period of year-over-year declines seen in the last year.
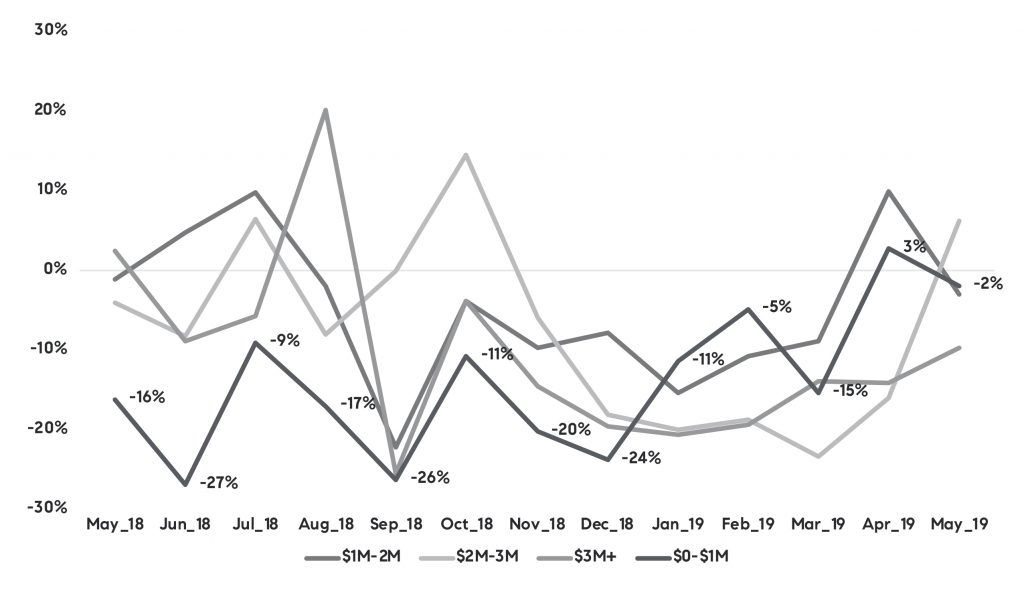
Figure 1 traces year-over-year changes in number of homes sold by price range. While the volatility of monthly changes makes it difficult to follow the trends, note the April increases in lower price ranges, and the surge in sales between $2 million and $3 million compared to the beginning of the year.
Figure 1 Year-over-year change in number of homes sold by price range
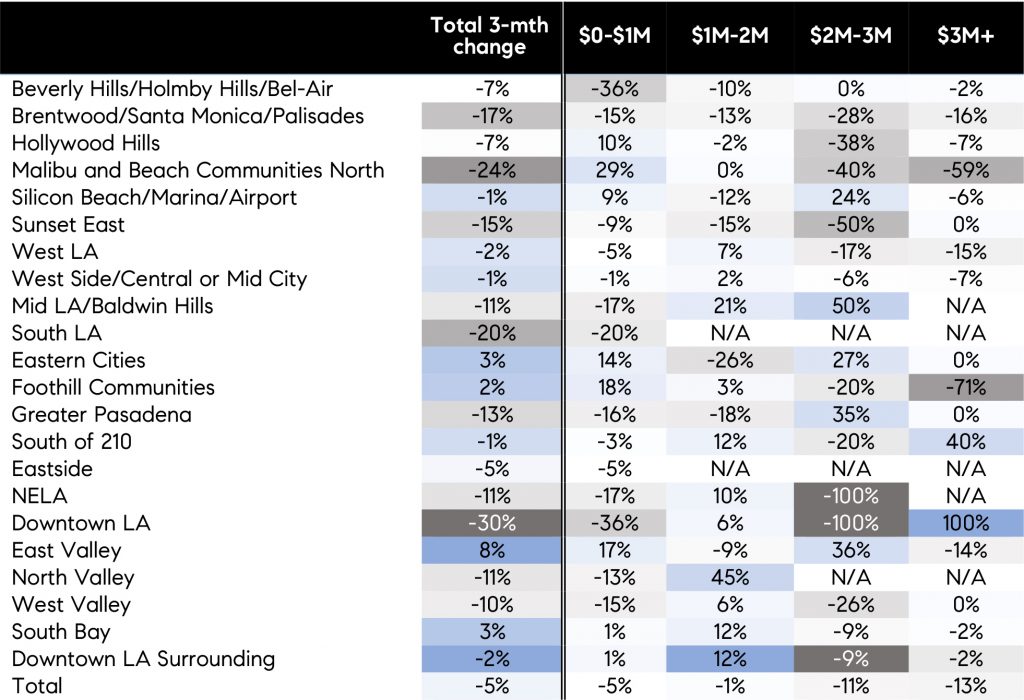
Considering the volatility in monthly changes, Table 1 summarizes 3-month average change (March-May) compared to last year. The East Side of Los Angeles, including East Valley (up 58 home sales YOY), Foothill Communities, and Eastern Cities, maintained relative strength compared to the other areas, generally due to strong sales of homes priced below $1 million. Sales below $1 million also fared well in the Greater Malibu region, Silicon Beach and Hollywood Hills, while sales priced between $1 million and $2 million fared well in West/Mid LA, North Valley, South Bay, NELA, and South of 210. The strength of the sale activity is largely a function of existing inventory.
Regarding the jump in sales priced between $2 and $3 million in May, the majority of the increase came from the East Valley, Eastern Cities, and Foothill Communities. Note that only 7 percent of Los Angeles sales are priced between $2 and $3 million.
Table 1
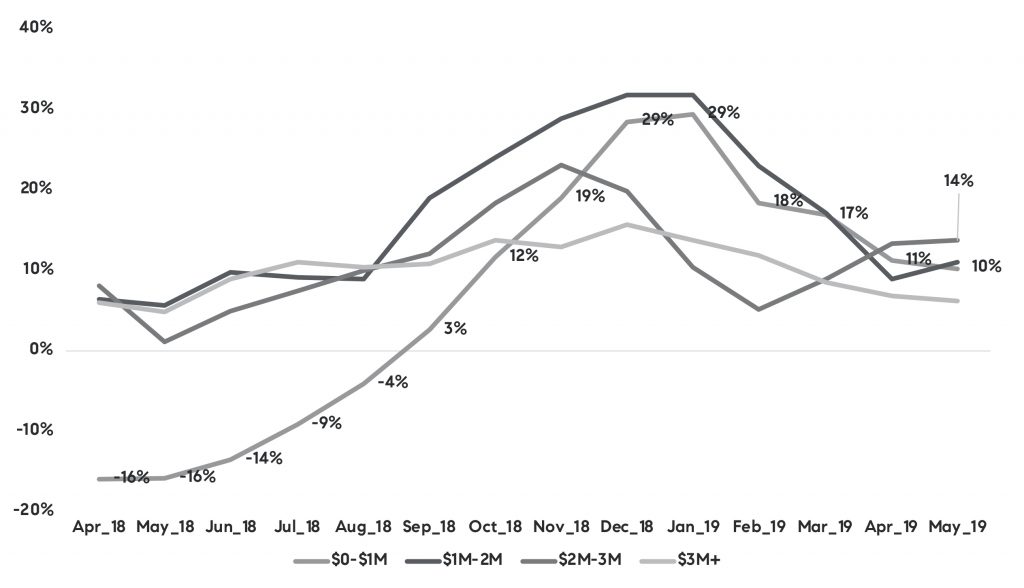
For-sale inventories continued to trend ahead of last year, however the rapid growth rates seen at the beginning of the year have slowed considerably and are back to rates seen at the same time last year. In other words, after 20-30 percent increases in inventory during the winter months, the rate of increase has slowed to an average of 10 percent. Figure 2 illustrates year-over-year changes in for-sale inventories by price range, with percentages denoted on the line tracing inventory below $1 million. Overall, while inventory is trending 10 percent above last year for the last two months, inventory priced between $2 and $3 million is growing at a higher rate in recent months, up 14 percent in May.
Figure 2 Year-oer-year change in for-sale invetnory by price range
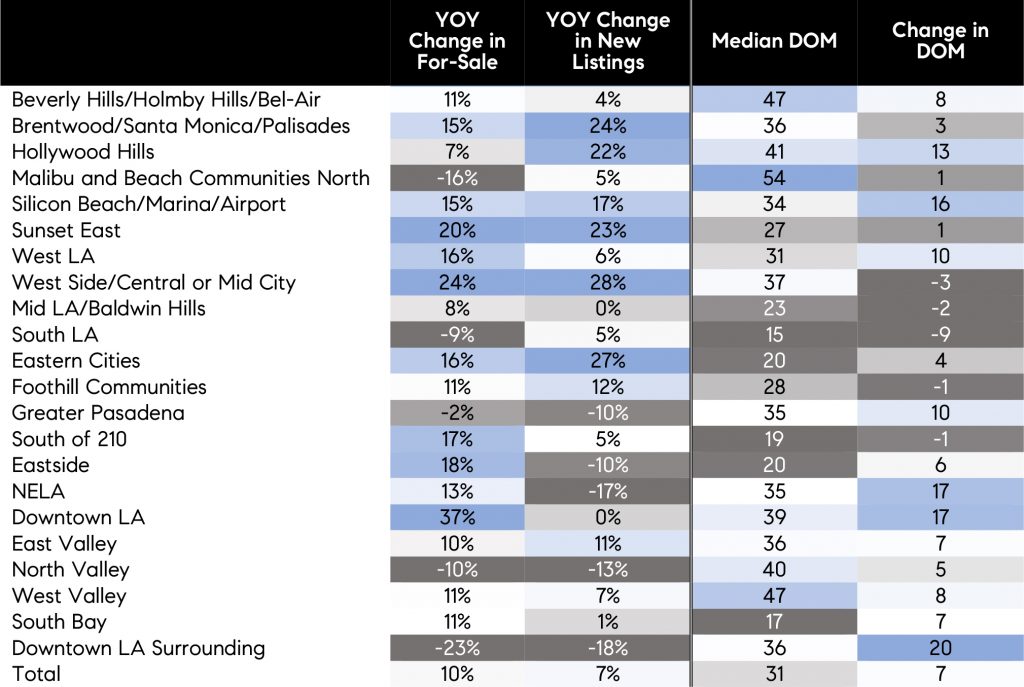
Furthermore, Table 2 illustrates changes in inventory by region, change in new listings, median days on market and change in days on market from last year. A few trends are of note. Inventory increased and seems to continue increasing (with increase in new listings) at the highest rate in many western parts of Los Angeles, such as Mid City, Sunset East, Silicon Beach, and Brentwood; while inventory is aging without increase in new listings on the East Side, NELA, North Valley, and areas surrounding DTLA. Those are also areas where days on market has increased relatively more, up 17 days.
Attractively priced and updated homes continue to sell at a relatively faster pace in more affordable communities and East of Downtown along with South Bay. Overall, homes are selling in 31 days on average, which is 7 days longer than last year. The increase in days on market is predominantly among lower priced homes with properties priced below $1 million taking 7 days longer to sell, or 27 days on average, and those priced between $1-$2 million taking 11 days, or 33 days on average. Homes priced beyond $2 million generally taken longer to sell anyway, and there has not been a notable change from last year.
Table 2
In addition, absorption of available inventory has improved in spring, from around 15 percent in the first quarter to an average of 20 percent in May, suggesting buyers are cautiously optimistic in most areas. Figure 3 traces out 3-month moving average of absorption rate together with percent of homes selling over the asking price. Both indicators suggest that buyer demand has notably picked up in recent months, and while it still has not matched the levels seen in last couple of years, it measures up with conditions seen in 2016.
Figure 3 3-month moving average of absorption rate and share of homes that sold over asking price
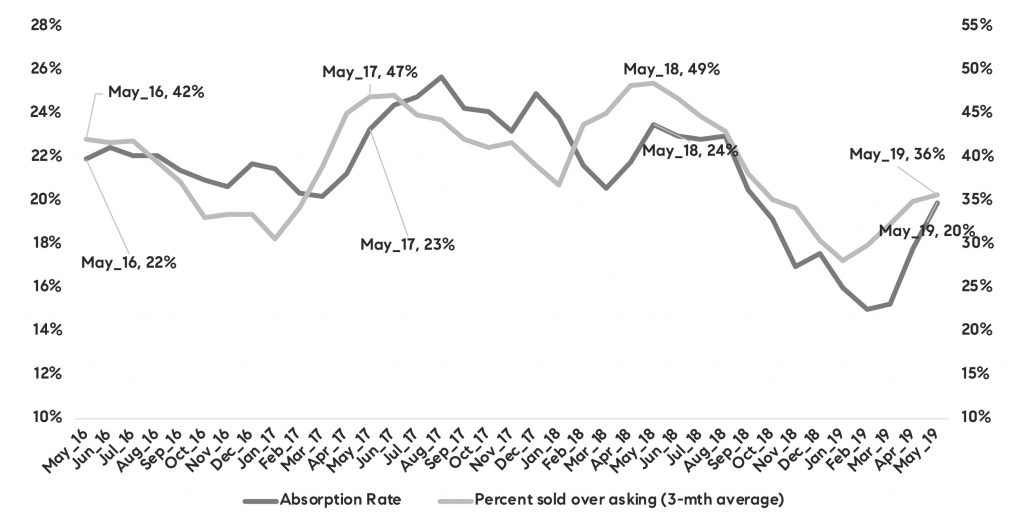
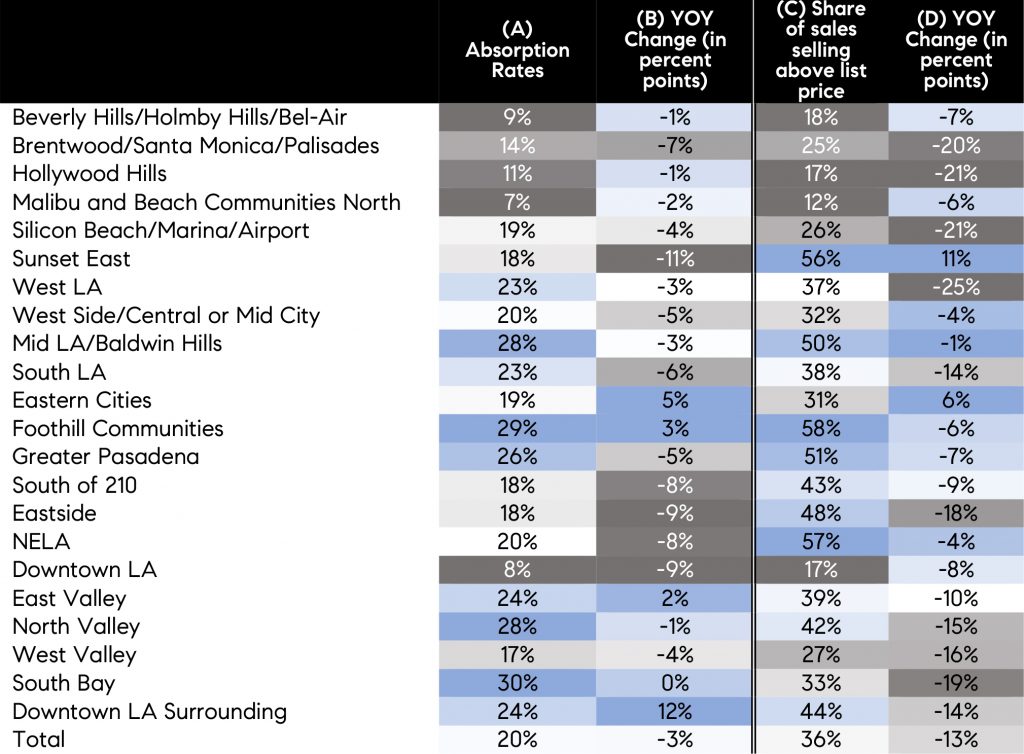
Table 3 summarizes absorption rates in May, year-over-year change in absorption rate, share of homes that sold over the asking price, and the change from last year. The change in absorption rates from last year suggests that the number of homes sold from the available inventory is only 3.5 percent points below last year, when they were 24 percent. Although overall absorption rate is down, some areas such as Eastern Cities, Foothill Communities, East Valley, and areas surrounding DTLA have seen an increase in absorption rates.
In addition, while the share of homes selling over the asking price has declined by 13 percent points from 49 percent last year to 36 percent in May, Eastern cities (up 6 percent points), and Sunset East (up 11 percent points) have seen more homes selling over the asking price. A number of West Side areas, such as Brentwood/Santa Monica/Palisades, West LA, and Hollywood Hills, have seen buyer competition decline markedly from last year. Greater Pasadena with Foothill Communities, NELA, and Sunset East continue to have determined buyers and more than 50 percent of homes sell over the asking price.
Table 3
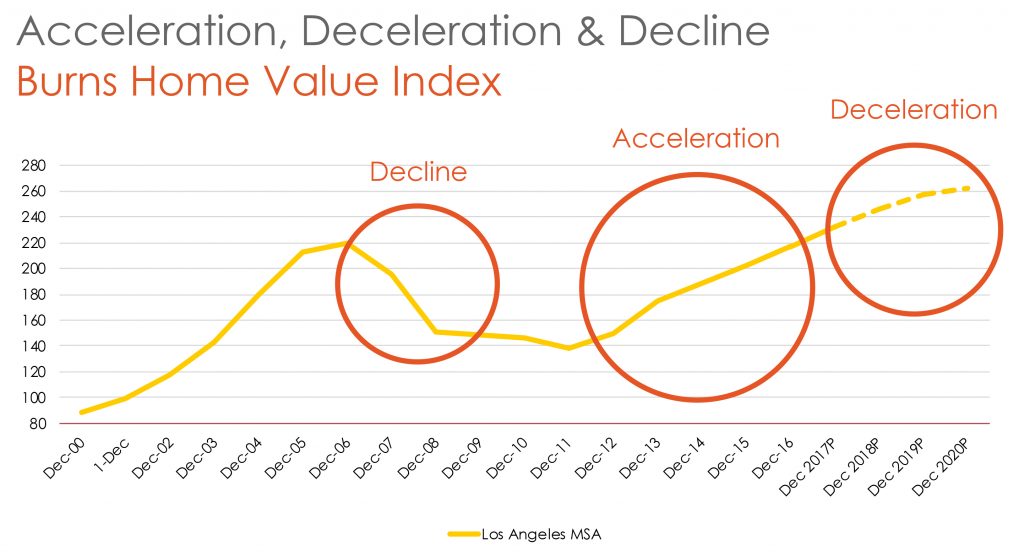
Lastly, the question remains, where does the Los Angeles housing market go from here? As discussed last month, median home price growth remained flat overall since the beginning of the year and remained so in May, meaning that following seasonal changes, it is back to the last year levels. A few areas did see some price increases, mostly value-driven, compared to last year — namely Eastside, areas surrounding DTLA, South LA, and Mid City where prices are about 6 to 8 percent above last year. But generally, softening of price growth has been anticipated at this point of the housing cycle. In the Pacific Union Real Estate Economic Forecast 2020, see Figure 4, our housing experts discussed the expectations around the normalization path, suggesting that home prices will reach a point in 2019 when they will remain flat for couple of years. Unfortunately, softening of price growth may be alarming some buyers who fear that housing market correction is inevitable and are waiting for sellers to yield further and lower their prices. Nevertheless, while buyers may be expecting price declines, declines are likely to be very minimal and unlikely to resemble the correction that we saw in the last housing cycle. However, many conditions are different than the last cycle. Most importantly, credit conditions are significantly better than in the last cycle with the current housing boom driven by exceptionally solid underwriting, many all-cash sales, and almost negligible new construction growth, all of which suggest that the correction path is looking notably different.
Figure 4