
Executive Summary
After a large dip in housing market activity starting in the last quarter of 2018 and first quarter of 2019, housing markets in recent months have mostly bounced back to where they were last summer. The number of home sales trends about the same, home prices have recovered to again show annual increases, inventories are scarce, and absorption rates have returned to the same rates. Buyers, however, remain more constrained than last year leading to fewer bidding wars and longer time on the market. Still, last summer marked a cyclical peak in the most recent housing market renaissance.
Detailed Analysis
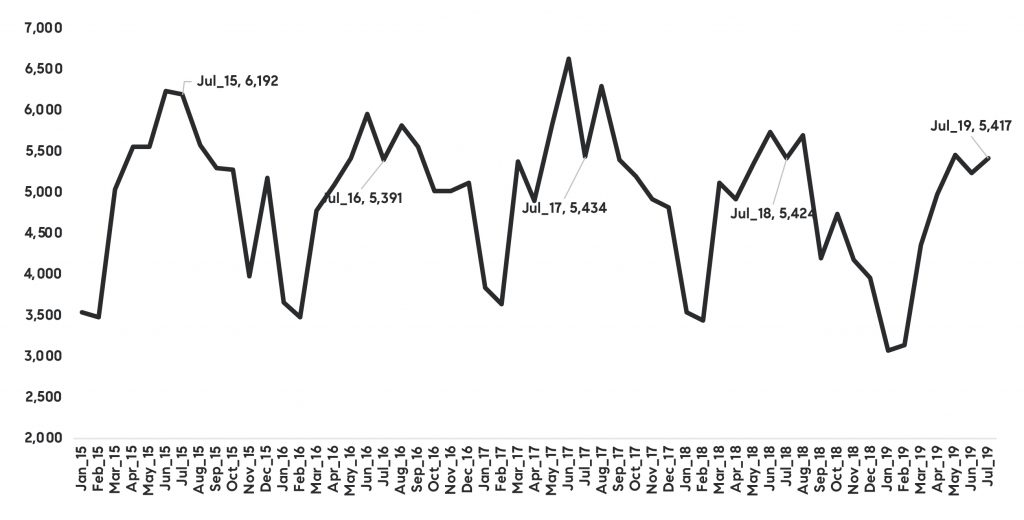
Housing markets in Los Angeles have been oscillating this summer. Home sales activity picked up speed in July, after some slowing in June, bringing activity back in line with stronger numbers seen in May. In July, total sales in Los Angeles County trended at the same level as July of last year, with an increase in sales of homes priced between $1 million and $2 million, up 5 percent year-over-year, being offset by slower sales in other price segments.
Strong activity among homes priced between $1 million and $2 million bring the levels of homes in that price range to the highest level in the last five years. Homes priced below $1 million declined 2 percent after some strong months seen in April and May. This suggests that while lower interest rates may be helping spur some refinance activity, the positive spillover on home sales activity has not fully realized. On the other hand, sales of homes priced over $3 million have picked up significantly in July, down only 1 percent after the average 17 percent year-over-year declines in the last eight months.
Consequently, some West Side communities, which experienced slower market conditions since last year, have finally seen more activity. Most notably, sales in Malibu and Beach Communities North have posted the first annual increase since last summer, up 11 percent year-over-year. The impact of wildfires has had a considerably negative impact on the area with overall year-to-date decline in sales of 26 percent. The most recent uptick was driven by strong sales of homes priced below $2 million while higher priced sales continue to lag.
In contrast, several more affordable communities, such as Eastside (East LA communities of El Sereno, Lincoln Heights and Boyle Heights) and NELA have seen a notable slowdown in sales in July, down about 30 percent year-over-year.
Figure 1 tracks total home sales in Los Angeles County over the last five years. Note that in the last three years, July sales dipped below June and August sales. That was not the case this year when July sales outperformed June sales. The monthly increase from June was driven by relatively stronger increases in the Malibu region, West Side/Central or Mid City, and Mid LA/Baldwin Hills. Again, relatively more affordable communities in Los Angeles, such as Eastside and NELA, saw large negative declines on a monthly basis, down about 20 percent. Nevertheless, monthly data can be volatile and are not indicative of longer lasting trends.
Figure 1
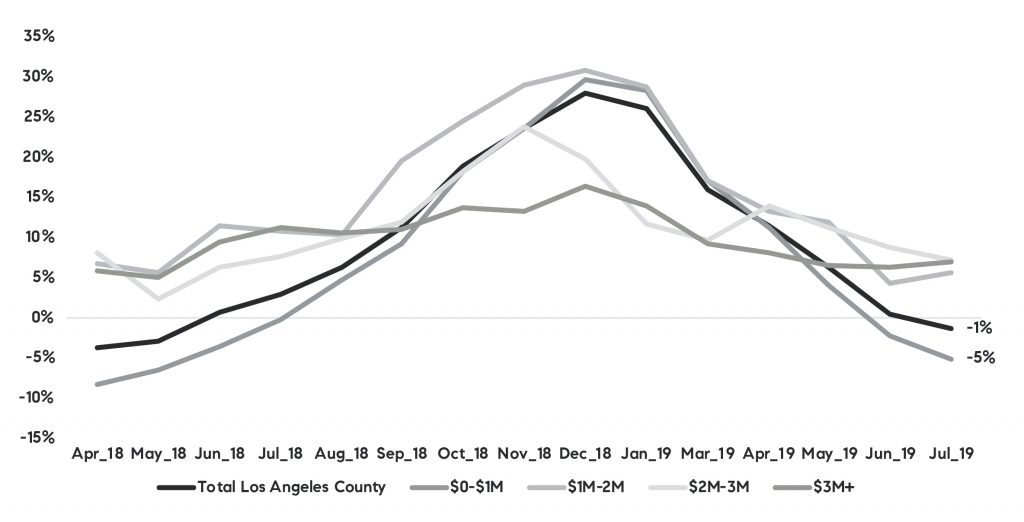
Unfortunately, however, availability of for-sale inventories continues to pose concern for housing market activity going forward. As Figure 2 suggests, for-sale inventory is once again trending below last year’s levels with July’s year-over-year decline for the overall inventory down one percent, and inventory priced below $1 million down 5 percent. Declines follow almost a year of year-over-year increases. And the lower priced inventory is now 24 percent below the 2015 levels.
Figure 2 Year-over-year change in for-sale inventory by price range
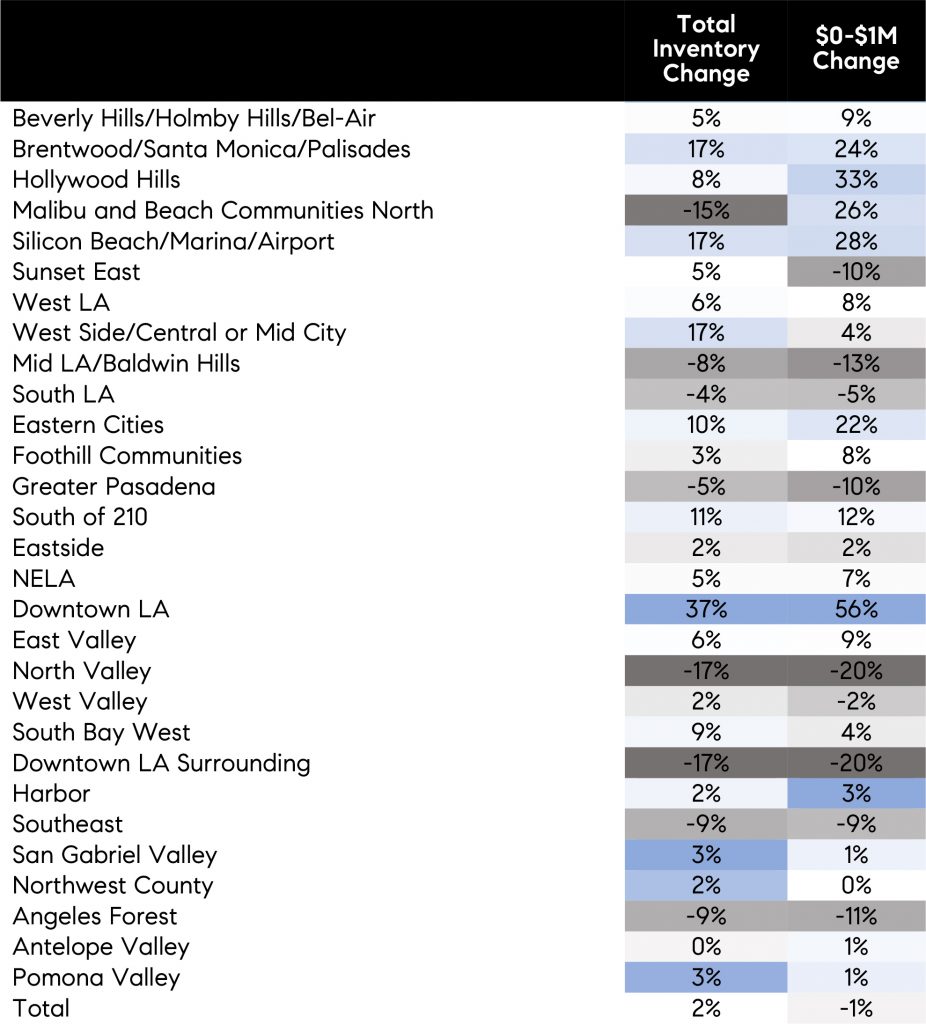
Interestingly though, while the lower priced inventory is on a decline again, some relatively higher-priced communities have seen gains in that inventory. Figure 3 illustrates 3-month average inventory change from last year for total inventory and inventory priced below $1 million. Blue highlighted fields for West Side communities including Brentwood, Hollywood Hills, Malibu and Silicon Beach show significant gains from last year. Overall inventory in the lower priced segment is relatively smaller in those communities, thus overall lower priced inventory is still declining. Looking forward, the growth of new listings suggests overall inventories, particularly lower priced inventories, will continue declining.
Figure 3
On the other hand, home prices have made a comeback in July after a period of no changes and some declines. In July, median home price in Los Angeles County reached another peak at $655,000 (see Figure 4). Last summer, the highest seasonal price was reached in June at $640,000. The 4 percent year-over-year increase in July was the first such increase this year. Nonetheless, variation in home price changes is notable with some areas again seeing strong acceleration in price growth.
Figure 4 Median home prices in Los Angeles county
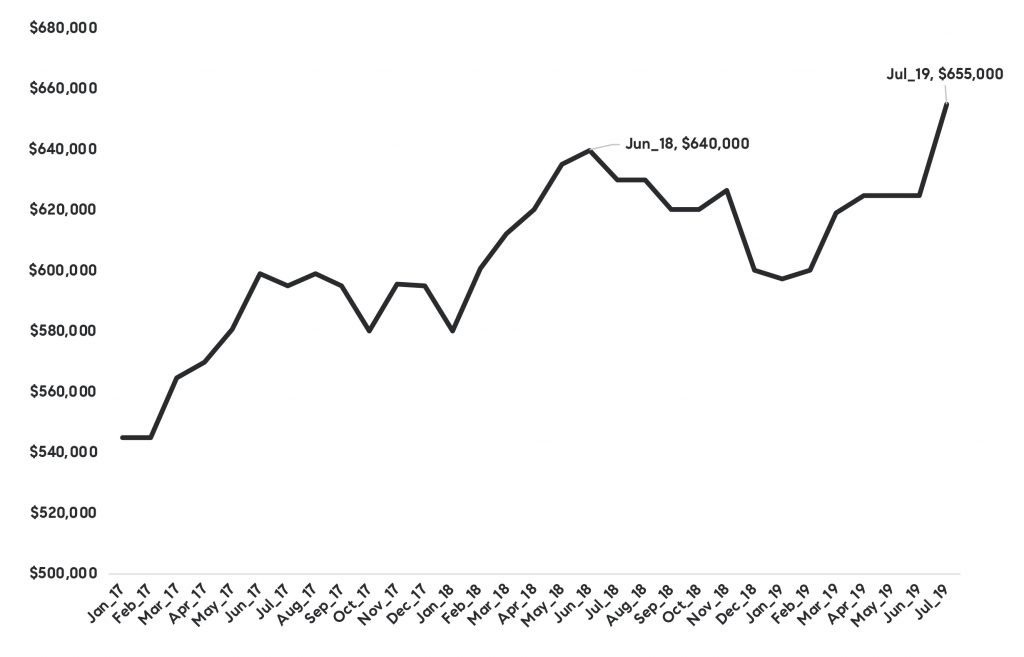
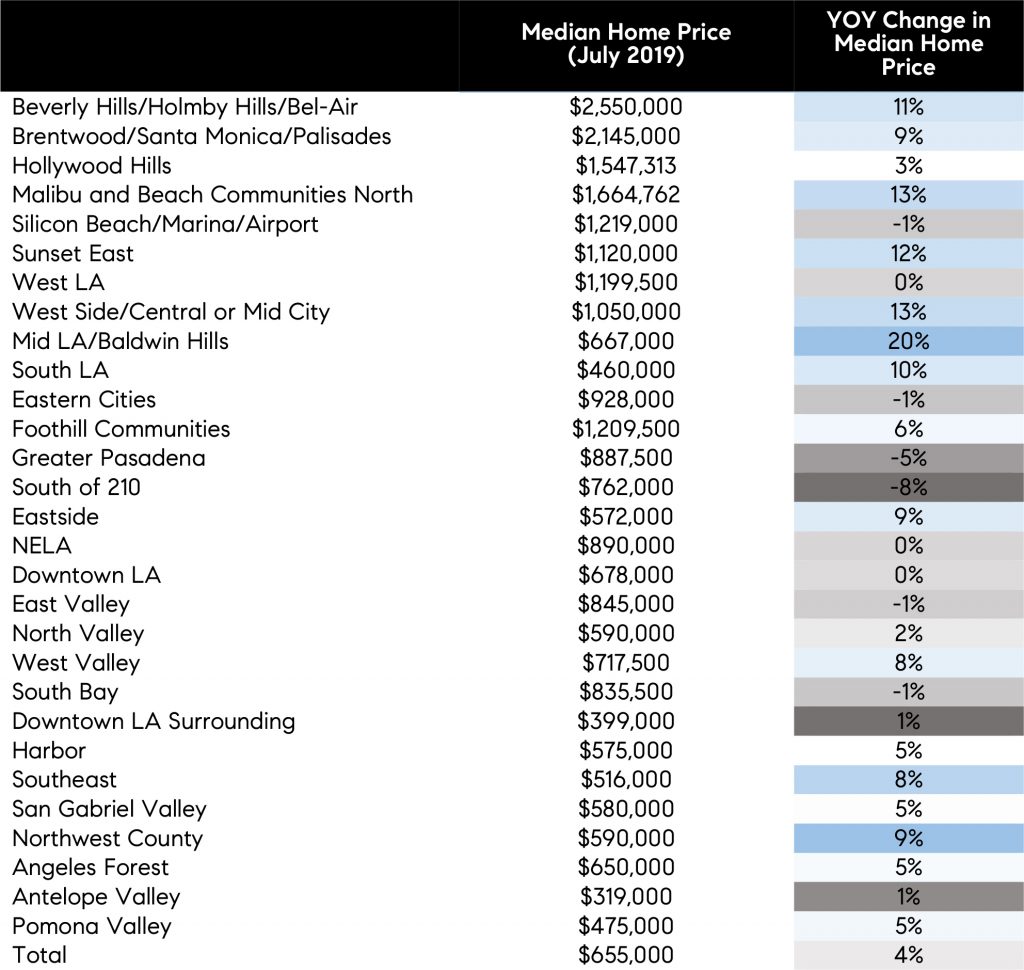
Figure 5 lists median home prices and year-over-year changes since last July. Strong acceleration in price growth was seen in Mid Los Angeles around greater Baldwin Hills and Mid City. Also, Malibu maintained the price growth that started last month after the area experienced some weakness in prices resulting from reconciliation of fire lots and overall weaker demand for higher priced homes. Price growth in Beverly Hills and Brentwood areas benefitted from a jump in higher priced sales.
July’s pick up in price growth is thus partially due to reignited demand for luxury homes and in part a function of lower mortgage rates which could have been a catalyst for some, as mortgage rates have been trending at levels not seen since 2017.
Figure 5
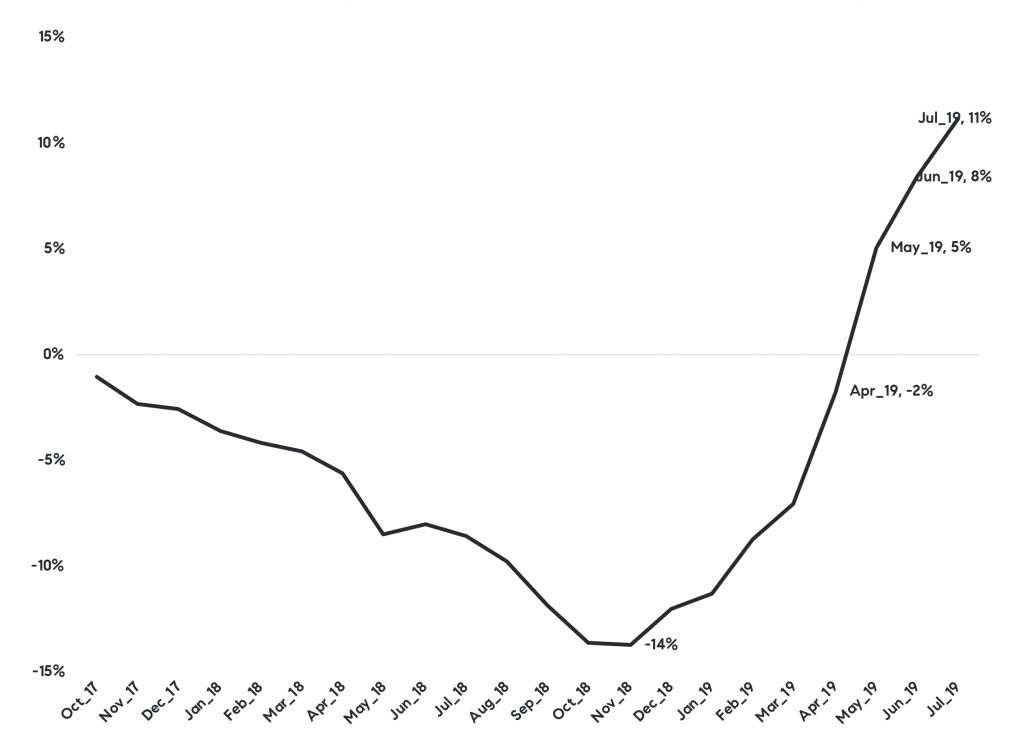
And lastly, what to expect in coming months? Market activity, while subdued by some account, has nevertheless returned to last year’s highs—when Los Angeles’s housing market likely reached its cyclical peak. The return in activity is a function of solid continued economy performance, jobs and wage growth, insufficient supply, and possibly lower mortgage rates. While it is difficult to say to which degree rates are helping with the demand, we also don’t know the counterfactual – meaning, where would the market be today if it wasn’t for the lower rates? The last chart shows year-over-year changes in units under contract (pending sales), which have been growing since May and have reached 11 percent in July. This suggest that at least in the month ahead, we should see continued improvement in the number of homes sold.
Figure 6 Year-over-year change in number of pending sales