The San Francisco metro area has once again put up the largest annual home price gain in the U.S., according to the most recent numbers from a prominent real estate index.
The latest S&P Case-Shiller Home Price Indices, which run two months behind, say that single-family home prices in the San Francisco area increased by 9.3 percent on an annual basis in December, the most of any of the 20 major U.S. metro areas included in the report. San Francisco returned to the top of the Case-Shiller index for the first time in 18 months in November, when prices rose by 8.9 percent year over year.
As was the case in the two preceding months, home prices in San Francisco grew at about double the national rate in December. Case-Shiller’s numbers put the U.S. annual rate of home price appreciation at 4.6 percent in the final month of 2014.
Although existing home price growth and sales across the country are at their normal levels, David M. Blitzer, managing director and chairman of the Index Committee at S&P Dow Jones Indices, said that he believes the housing recovery is “faltering,” a by-product of sluggish construction and new-home-sales activity.
“Before the current business cycle, any time housing starts were at their current level of about one million at annual rates, the economy was in a recession,” Blitzer said. “The softness in housing is despite favorable conditions elsewhere in the economy: strong job growth, a declining unemployment rate, continued low interest rates, and positive consumer confidence.”
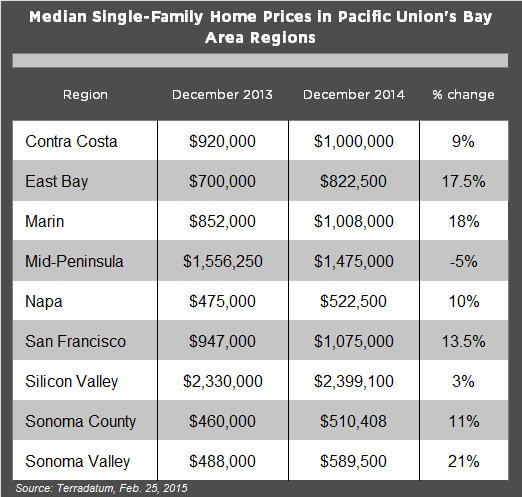
According to MLS data, the median single-family home price increased year over year in every one of Pacific Union’s Bay Area regions except the Mid-Peninsula subregion, which saw a slight decline. Home prices topped the $1 million mark in our Contra Costa County, Marin County, Mid-Peninsula, San Francisco, and Silicon Valley regions as 2014 came to a close.
The chart below provides more information on annual Bay Area home price changes. Also, be sure to check out Pacific Union’s fourth-quarter 2014 real estate report for more in-depth sales data and information on how we define our regions.
 (Image: Flickr/Bhautikjoshi)