Here’s a look at recent news of interest to homebuyers, home sellers, and the home-curious.
MANY SONOMA COUNTY WILDFIRE VICTIMS REBUILDING WITH MANUFACTURED HOMES
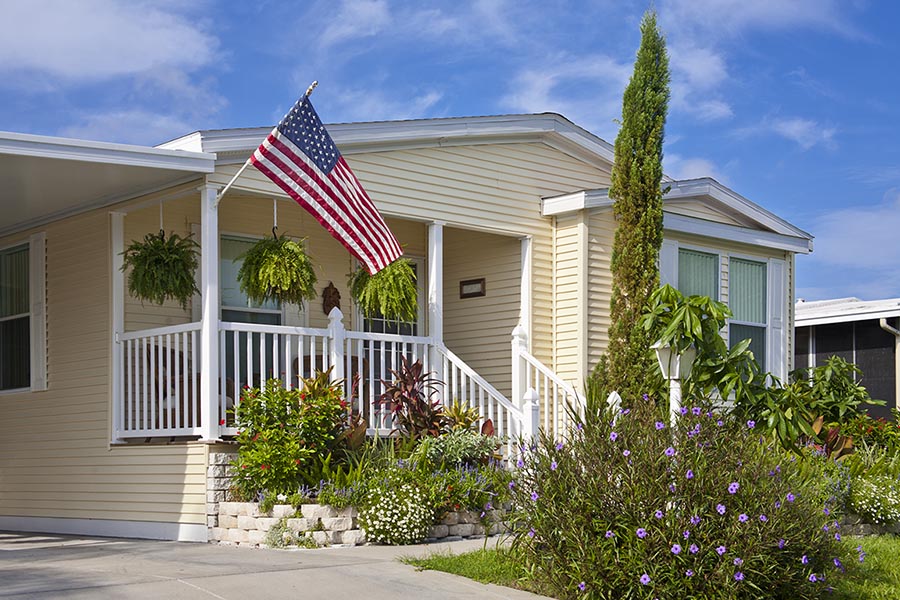
Although it may take Wine Country housing markets years to replace all the homes lost during October’s devastating wildfires, some residents are expediting the rebuilding process with prefabricated homes.
The New York Times reports on the trend, having interviewed several Sonoma County residents who lost their homes in the disaster. In Glen Ellen, where about three-quarters of the housing stock was damaged, one resident told the publication that almost everyone in the community she knows is rebuilding using manufactured homes.
The article puts the cost of constructing a home from the ground up in Northern California at $500 to $700 per square foot, and the process can take up to four years. A Seattle-based prefab housing manufacturer homeowner gave the Glen Ellen resident a quote of $350 to $400 per square foot and said the property could be built in six to eight months.
Although an abbreviated construction time is one of prefabricated homes’ largest benefits, writer Allison Arieff, who authored a book on the subject, doubts that they will achieve any kind of critical mass in California.
“The permitting is the hiccup,” she said.
SILICON VALLEY HOMES SOLD THE FASTEST IN THE NATION OVER THE PAST YEAR
Silicon Valley‘s well-documented housing inventory shortage has caused prices to skyrocket over the past year, and buyers there need to act faster than anywhere else in country to successfully seal a deal.
A realtor.com analysis of the 300 largest U.S. housing markets found that the average home in the San Jose metropolitan area sold in a median 28.6 days from February 2017 to January 2018. Buyer demand in the region remains intense, with some properties receiving up to 70 offers, pushing the median list price up by 26.4 percent year over year in February to $1.1 million.
In some of Silicon Valley’s most sought-after communities, homes are selling even faster than that as 2018 begins. According to Pacific Union’s latest monthly real estate update, single-family homes in Atherton, Los Altos, Los Altos Hills, Menlo Park, Palo Alto, Portola Valley, and Woodside sold in an average of 20 days of in February. Single-family homes in Burlingame, Hillsborough, and San Mateo left the market in an average of 18 days last month.
BAY AREA BUYERS AGAIN MADE THE LARGEST DOWN PAYMENTS IN THE FOURTH QUARTER
Bay Area homebuyers placed the largest down payments in the country in the fourth quarter of 2017, continuing a trend recorded in the previous two quarters.
ATTOM Data Solutions’ latest U.S. Residential Property Loan Origination Report says that homebuyers in the San Jose metropolitan area put down median $268,000 down payments in the fourth quarter, up from $247,000 in the third quarter and still the highest in the U.S. Buyers in the region put down almost 15 times more money than the average U.S. buyer, who placed median $18,000 down payments.
San Francisco had the nation’s second largest down payment at $174,500, up slightly quarter over quarter. The other three housing markets with the biggest down payments were also in California: Santa Rosa, ($123,450), Los Angeles ($119,800), and Ventura ($107,000).
CALIFORNIA HOMEOWNERS ENJOY THE NATION’S BIGGEST EQUITY GAINS
The Golden State’s hefty home prices helped owners gain the largest amounts of equity in the nation in the most recently completed quarter, while very few homeowners in San Francisco are still underwater.
According to CoreLogic’s new Homeowner Equity Insights report, the average California homeowner gained $44,000 in equity year over year in the fourth quarter of 2017, about three times the national average. Home-equity increases were highest on the East and West Coasts, where appreciation has been the most rapid and supply constraints are the most pronounced.
The report found that just 0.6 percent of homeowners in the San Francisco metro area were underwater in the fourth quarter, the lowest amount of negative equity of any of the 10 major housing markets for which CoreLogic tracks data.
(Photo: iStock/Marje)

